Final Year Group Project · 2025
CheckMate
Turning complex AI-powered news analysis into an approachable experience. Built for browser, web-extension and messaging platforms. Team emerged 1st for the Dell Cloud Native Experience Award 2025.
// The challenge
How could we make AI news analysis easy to understand and natural to use where people already read?
01. Overview
From an article to a clearer understanding
CheckMate was my final-year group project: an AI-powered news analysis tool designed to help young readers examine an article's facts, sentiment, emotion and potential propaganda techniques. The experience spanned across a Web App, Chrome extension and Telegram messaging interface.
As the Design Lead and Frontend Software Engineer, I shaped the reading and analysis flows, built the Figma design system, implemented the React interface and used Maze to evaluate the prototypes.
While the large language models and backend handling were a team effort, my focus stayed largley on how people encountered, navigated and understood the results.
| tools used
Figma · React · JavaScript · HTML/CSS · Maze · GitHub · Confluence · Jira
02. Understanding readers
The gap between valuing analysis and making it a habit
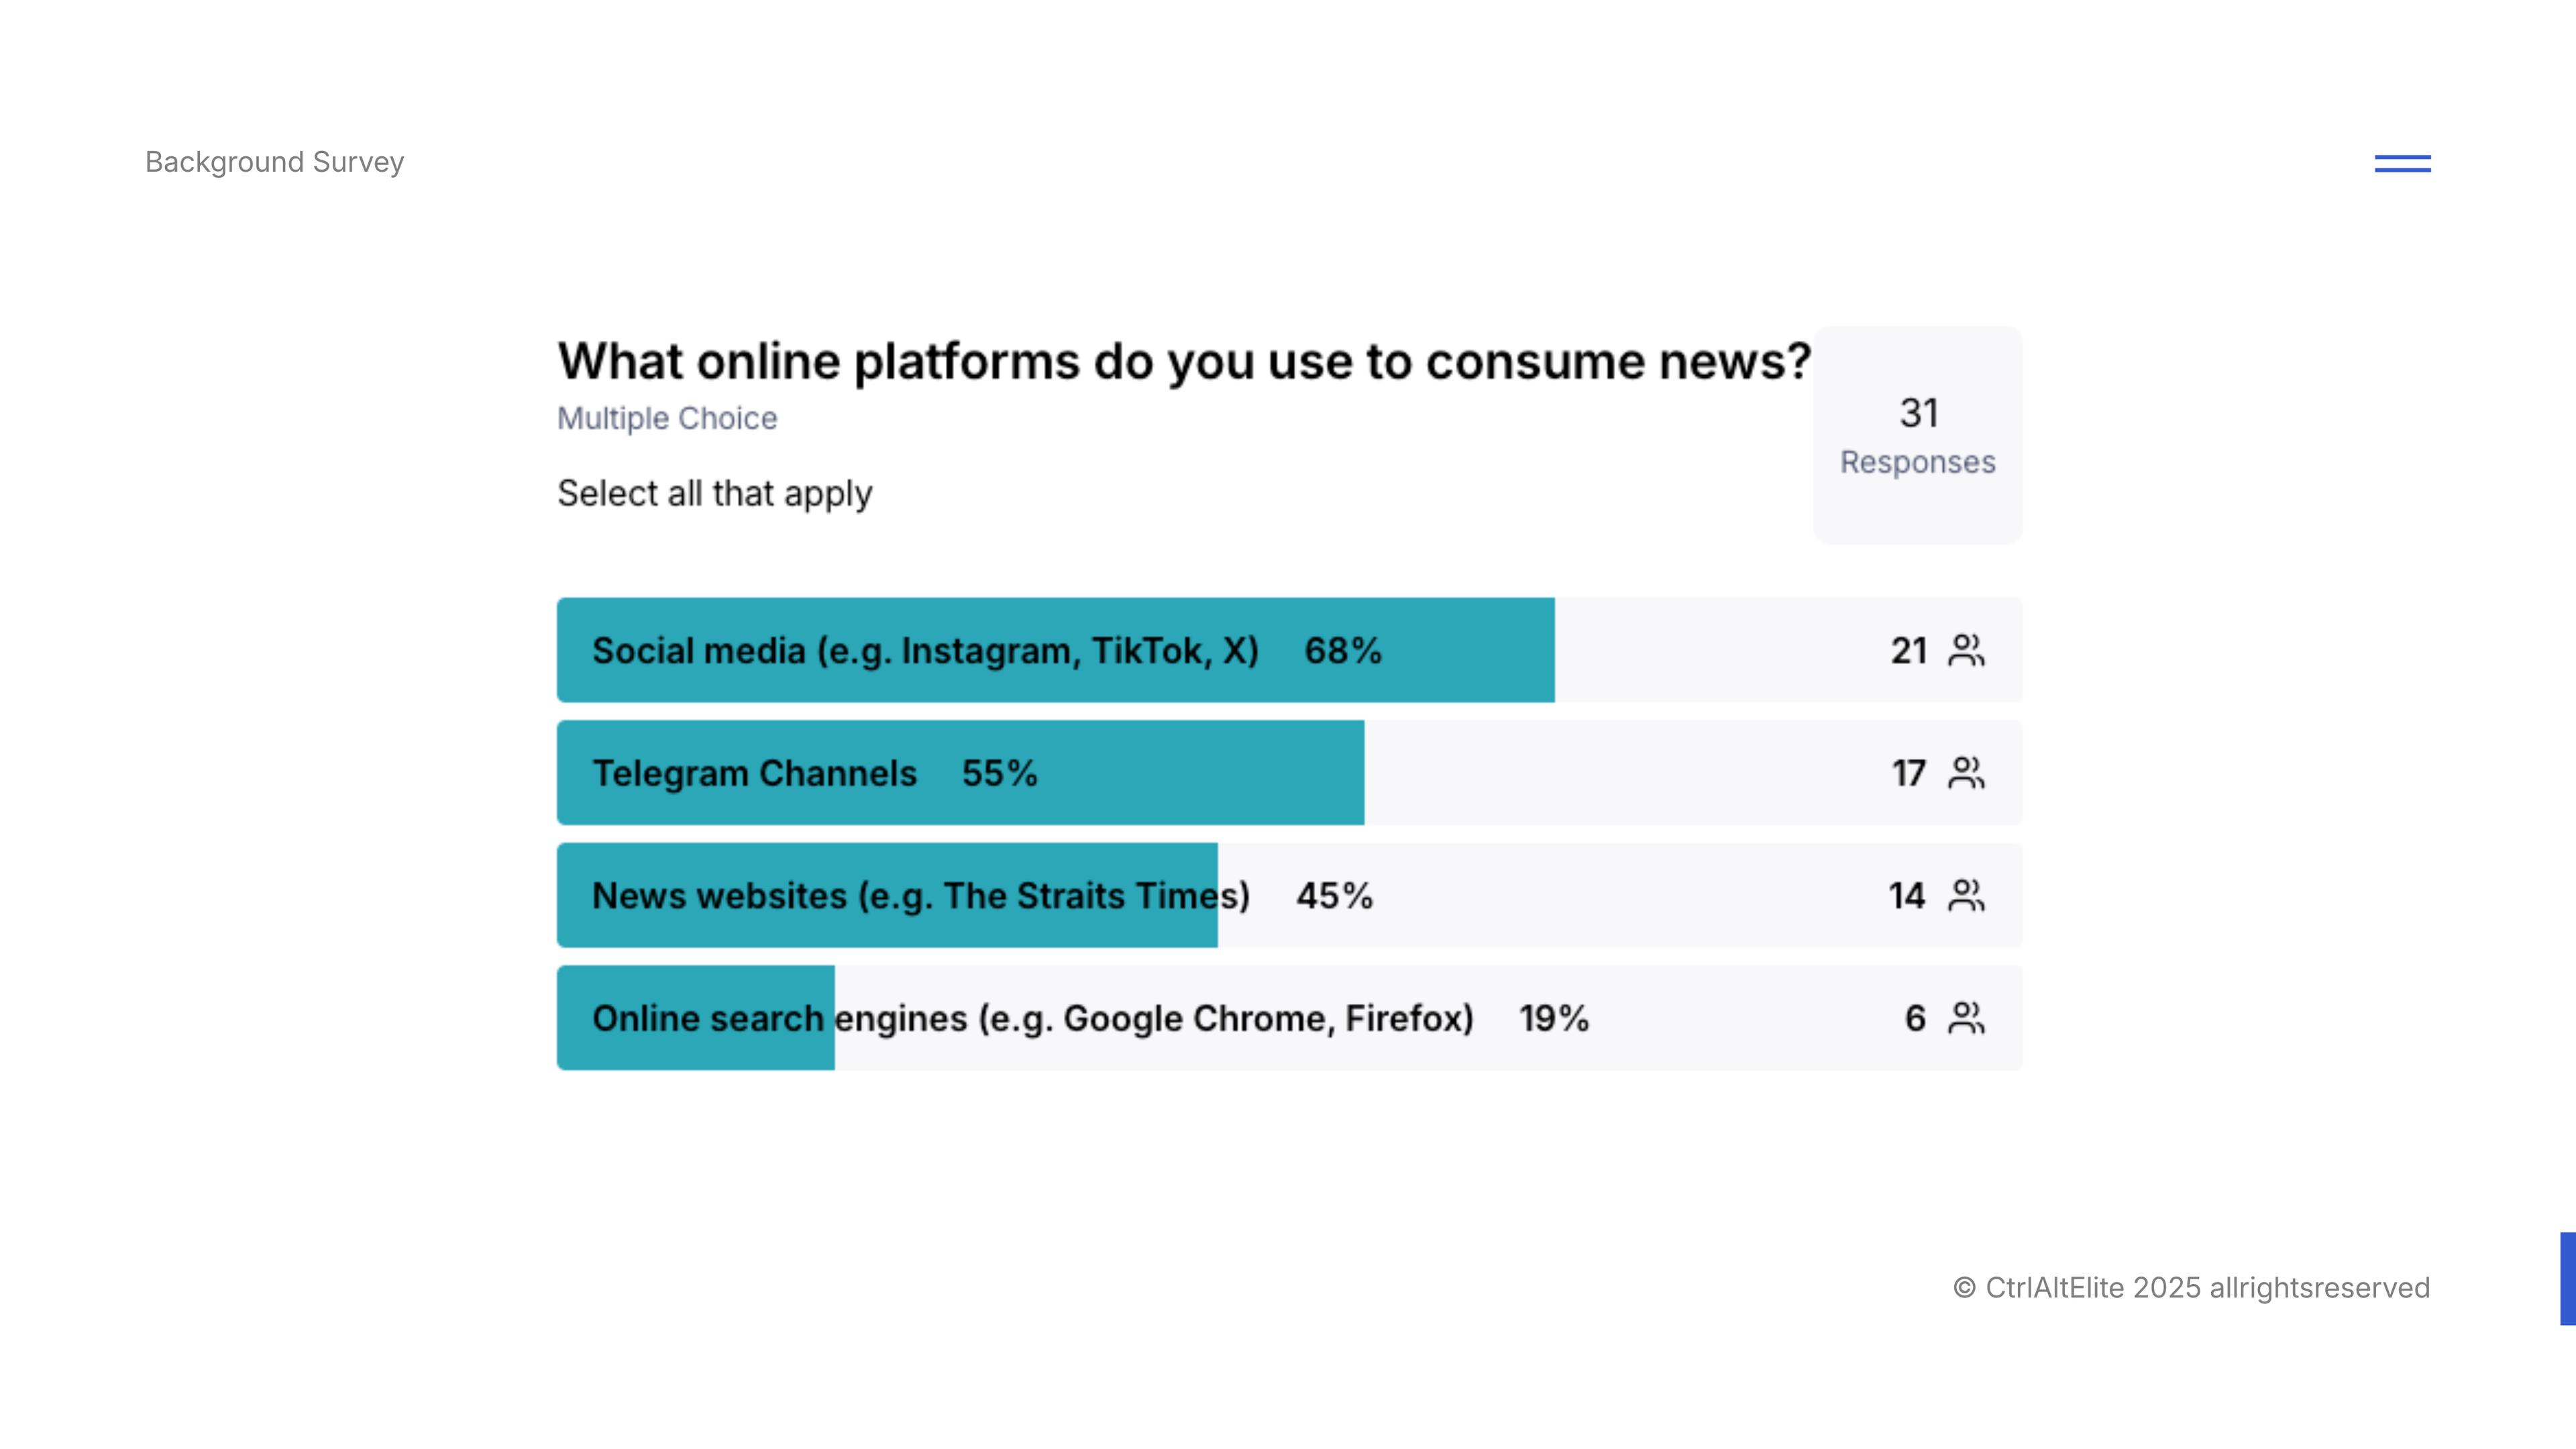
Our discovery research began with a background survey of 31 participants aged 18–35. Their self-reported habits suggested an opportunity to bring analysis into the places where they already consumed news.
social media
emerged as the main platform where youths consumed their news from.
17 of 31 (55%) also selected Telegram channels, giving us a direct reason to include a bot in the experience.
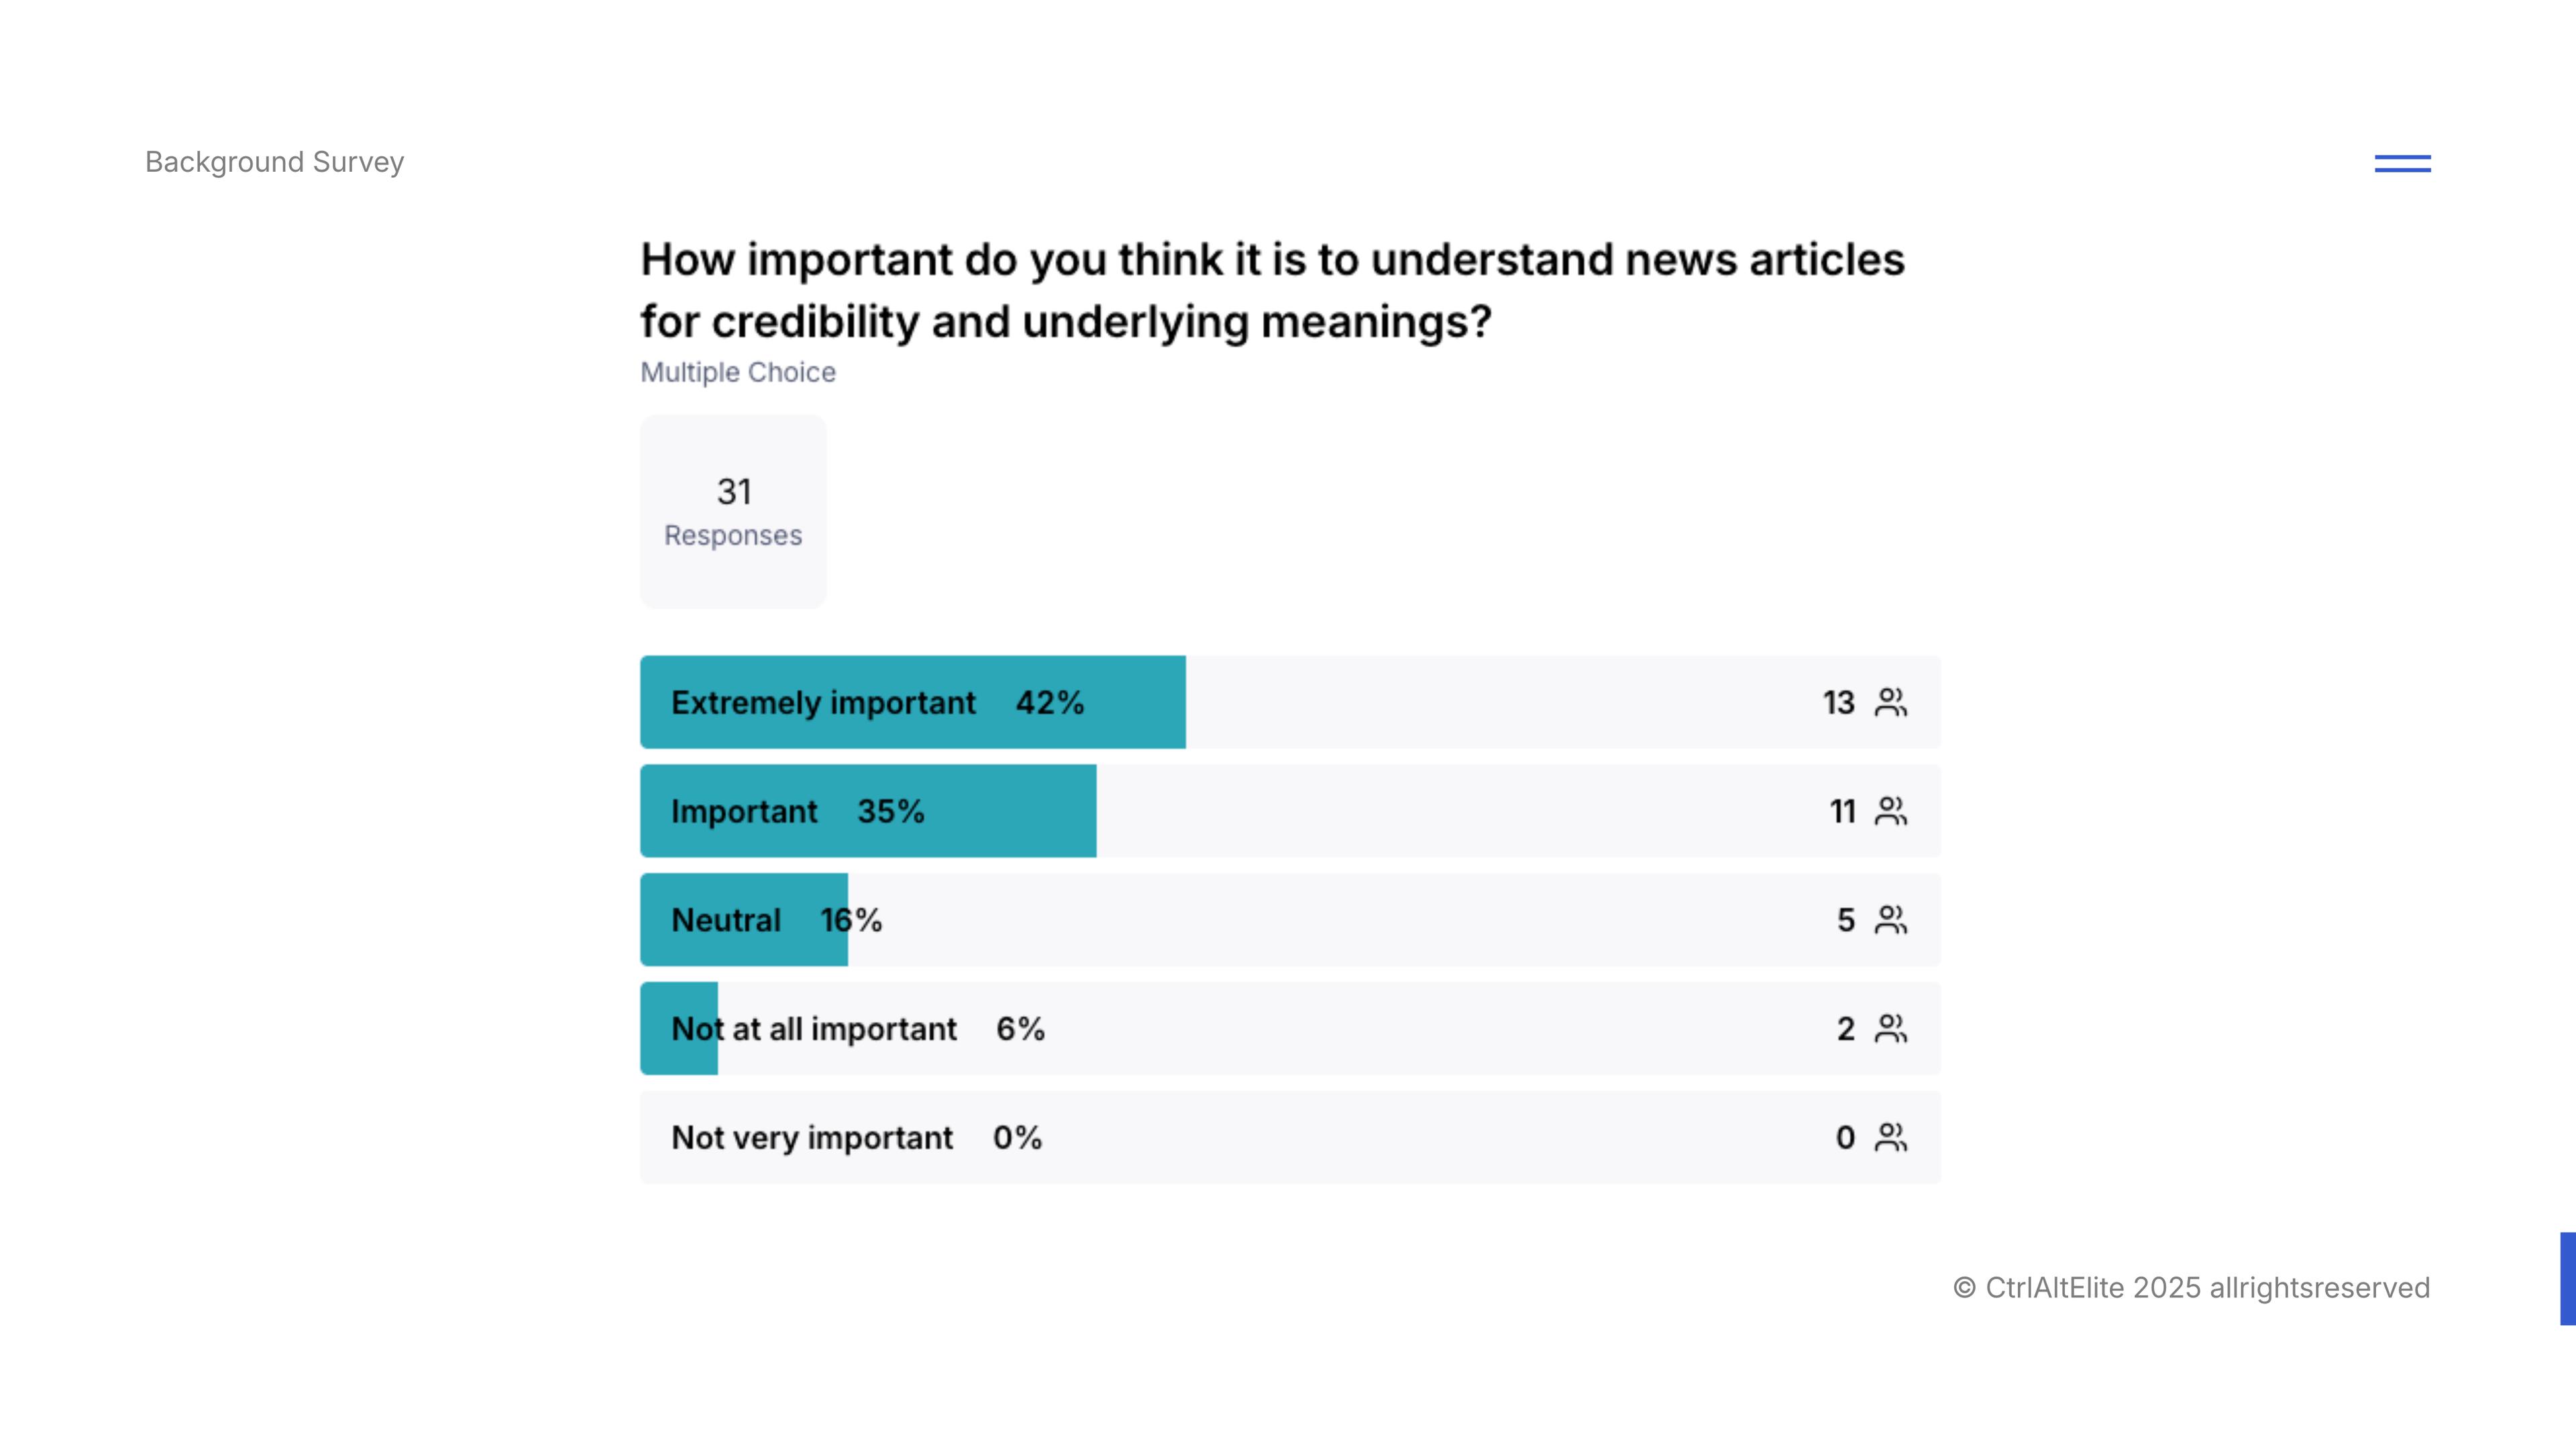
77%
out of 31 respondents considered "understanding news for credibility" important or extremely important.
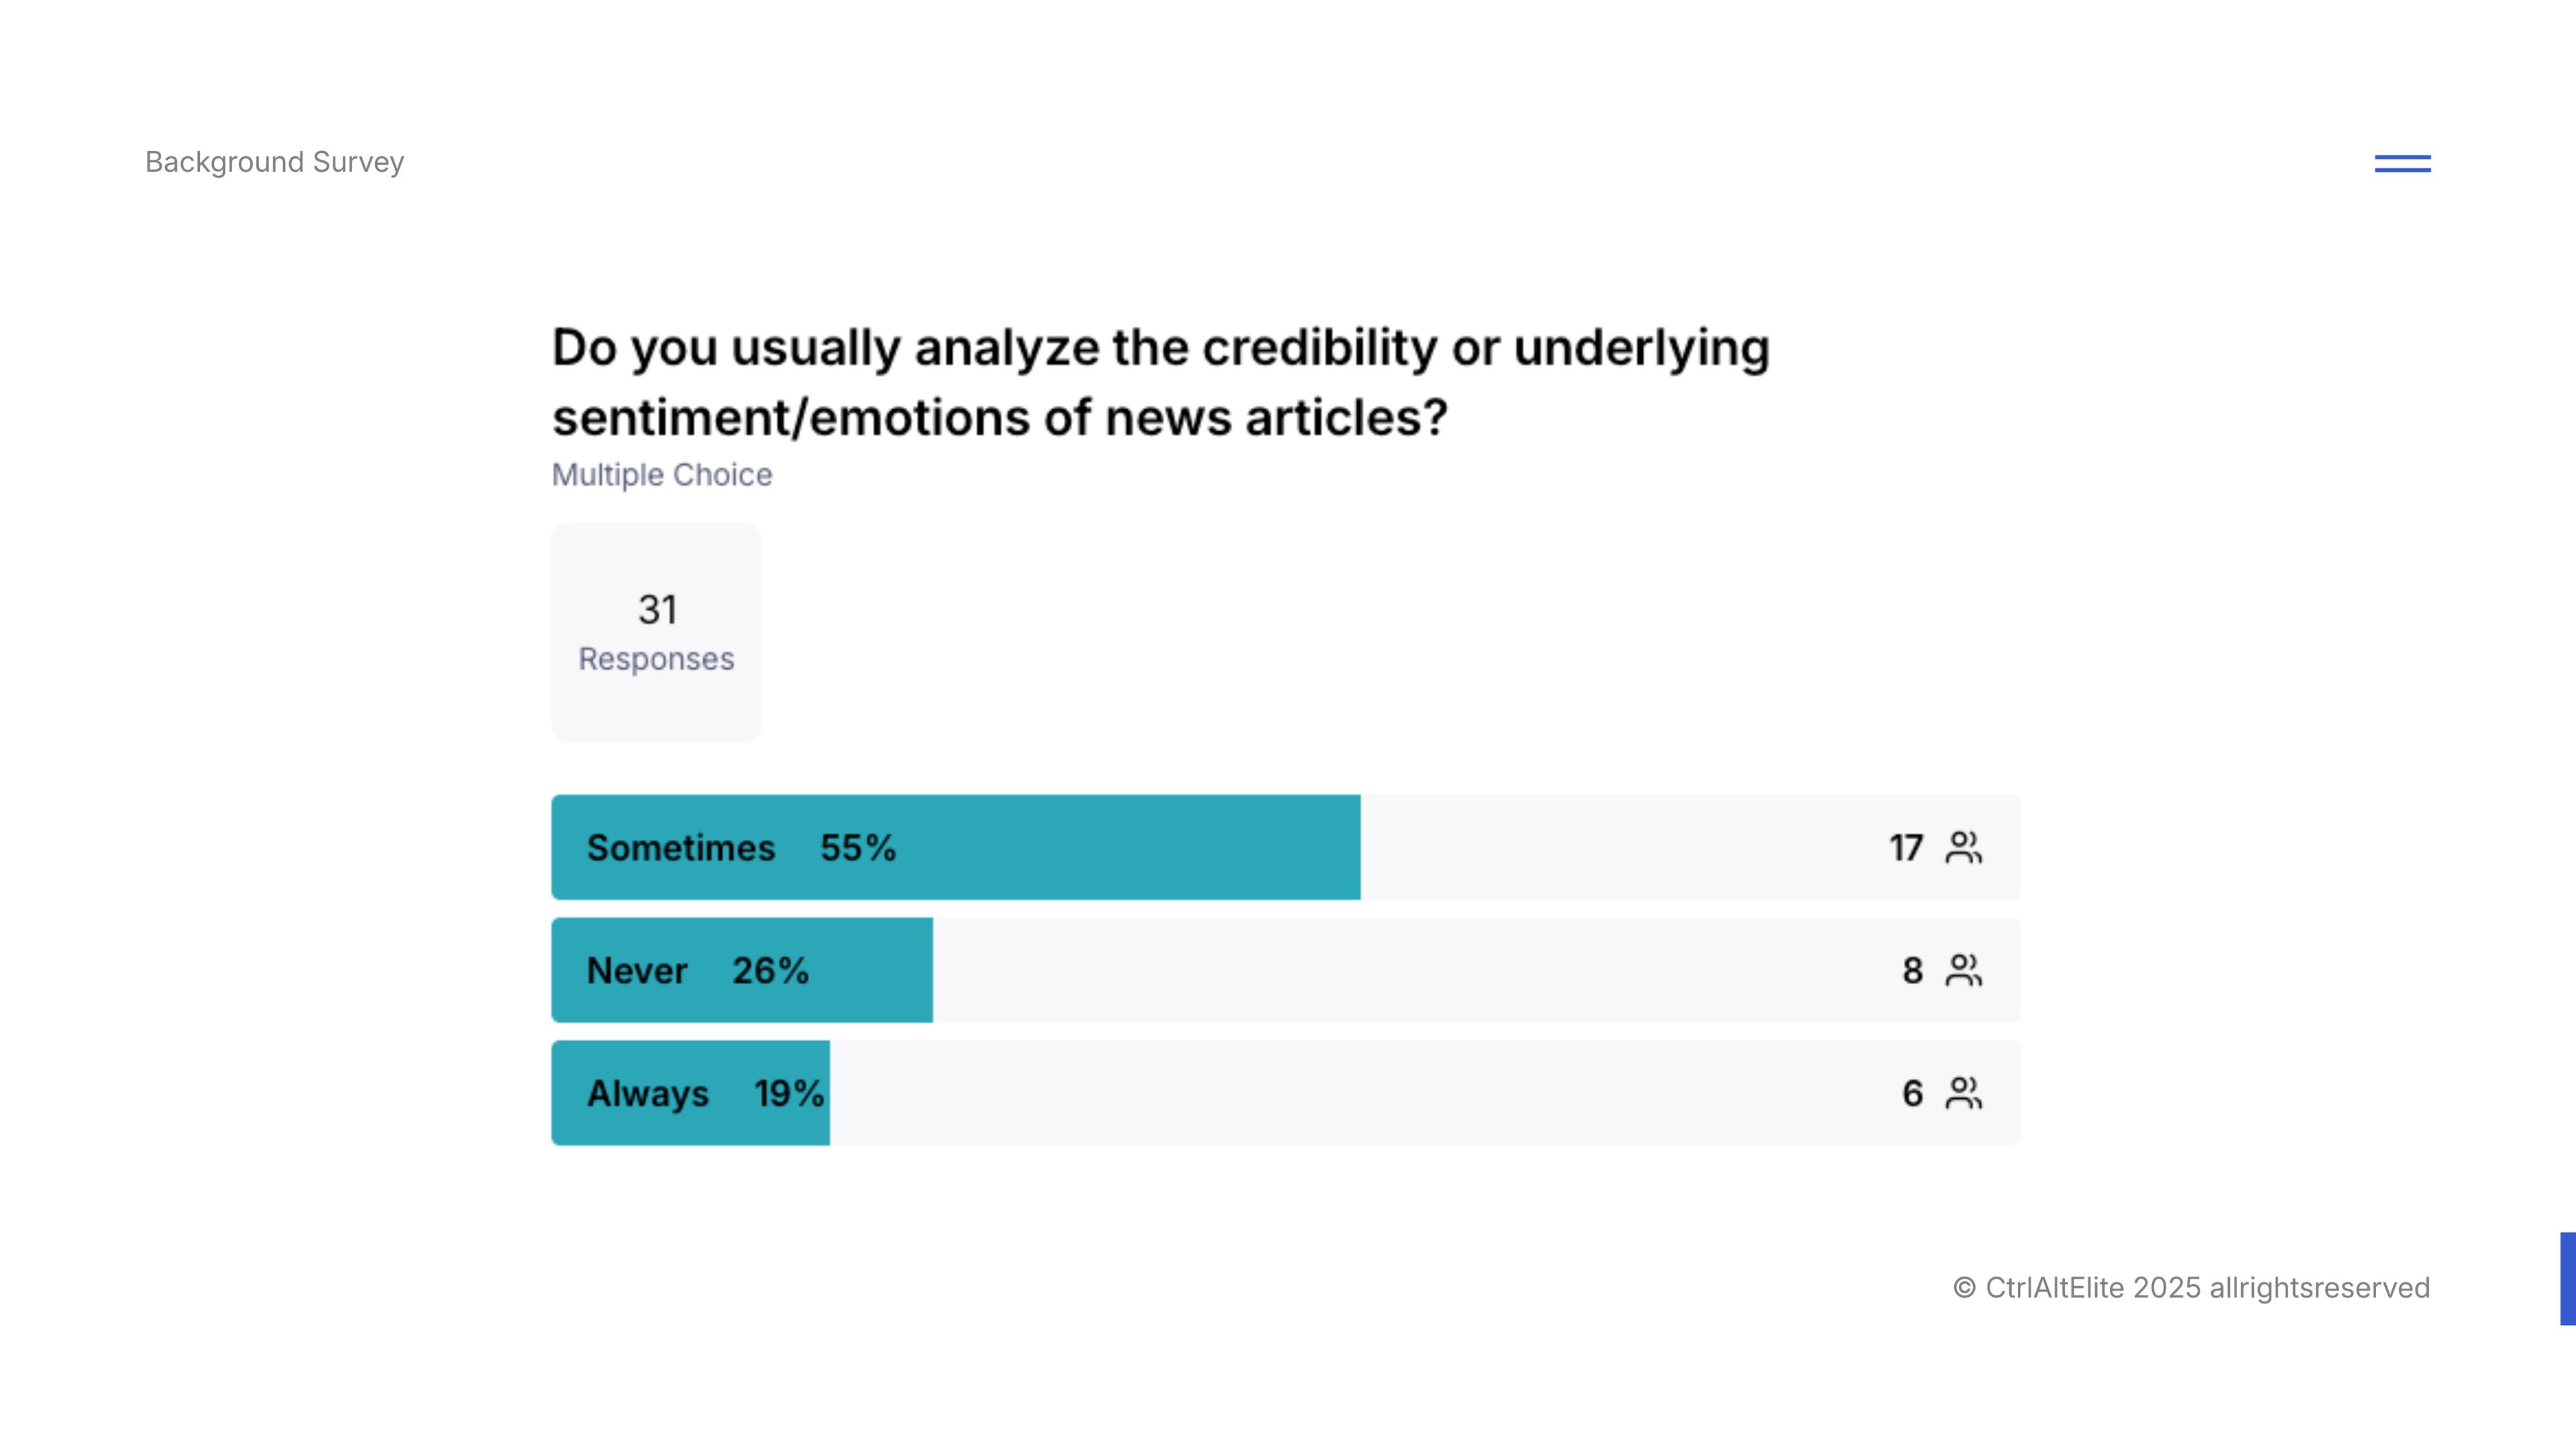
19%
Yet only a small minority said they would always "analyse the credibility or underlying sentiment/emotions of news articles".
This showed a gap between perceived importance and the actual reported behaviour.
03. Shaping the experience
A reading journey across three channels
I used the research to frame two design priorities: an accessible starting point and a manageable analysis view. I documented the flows and reusable components in Figma and Confluence, then carried those decisions into React.
Entry points
Start close to the article
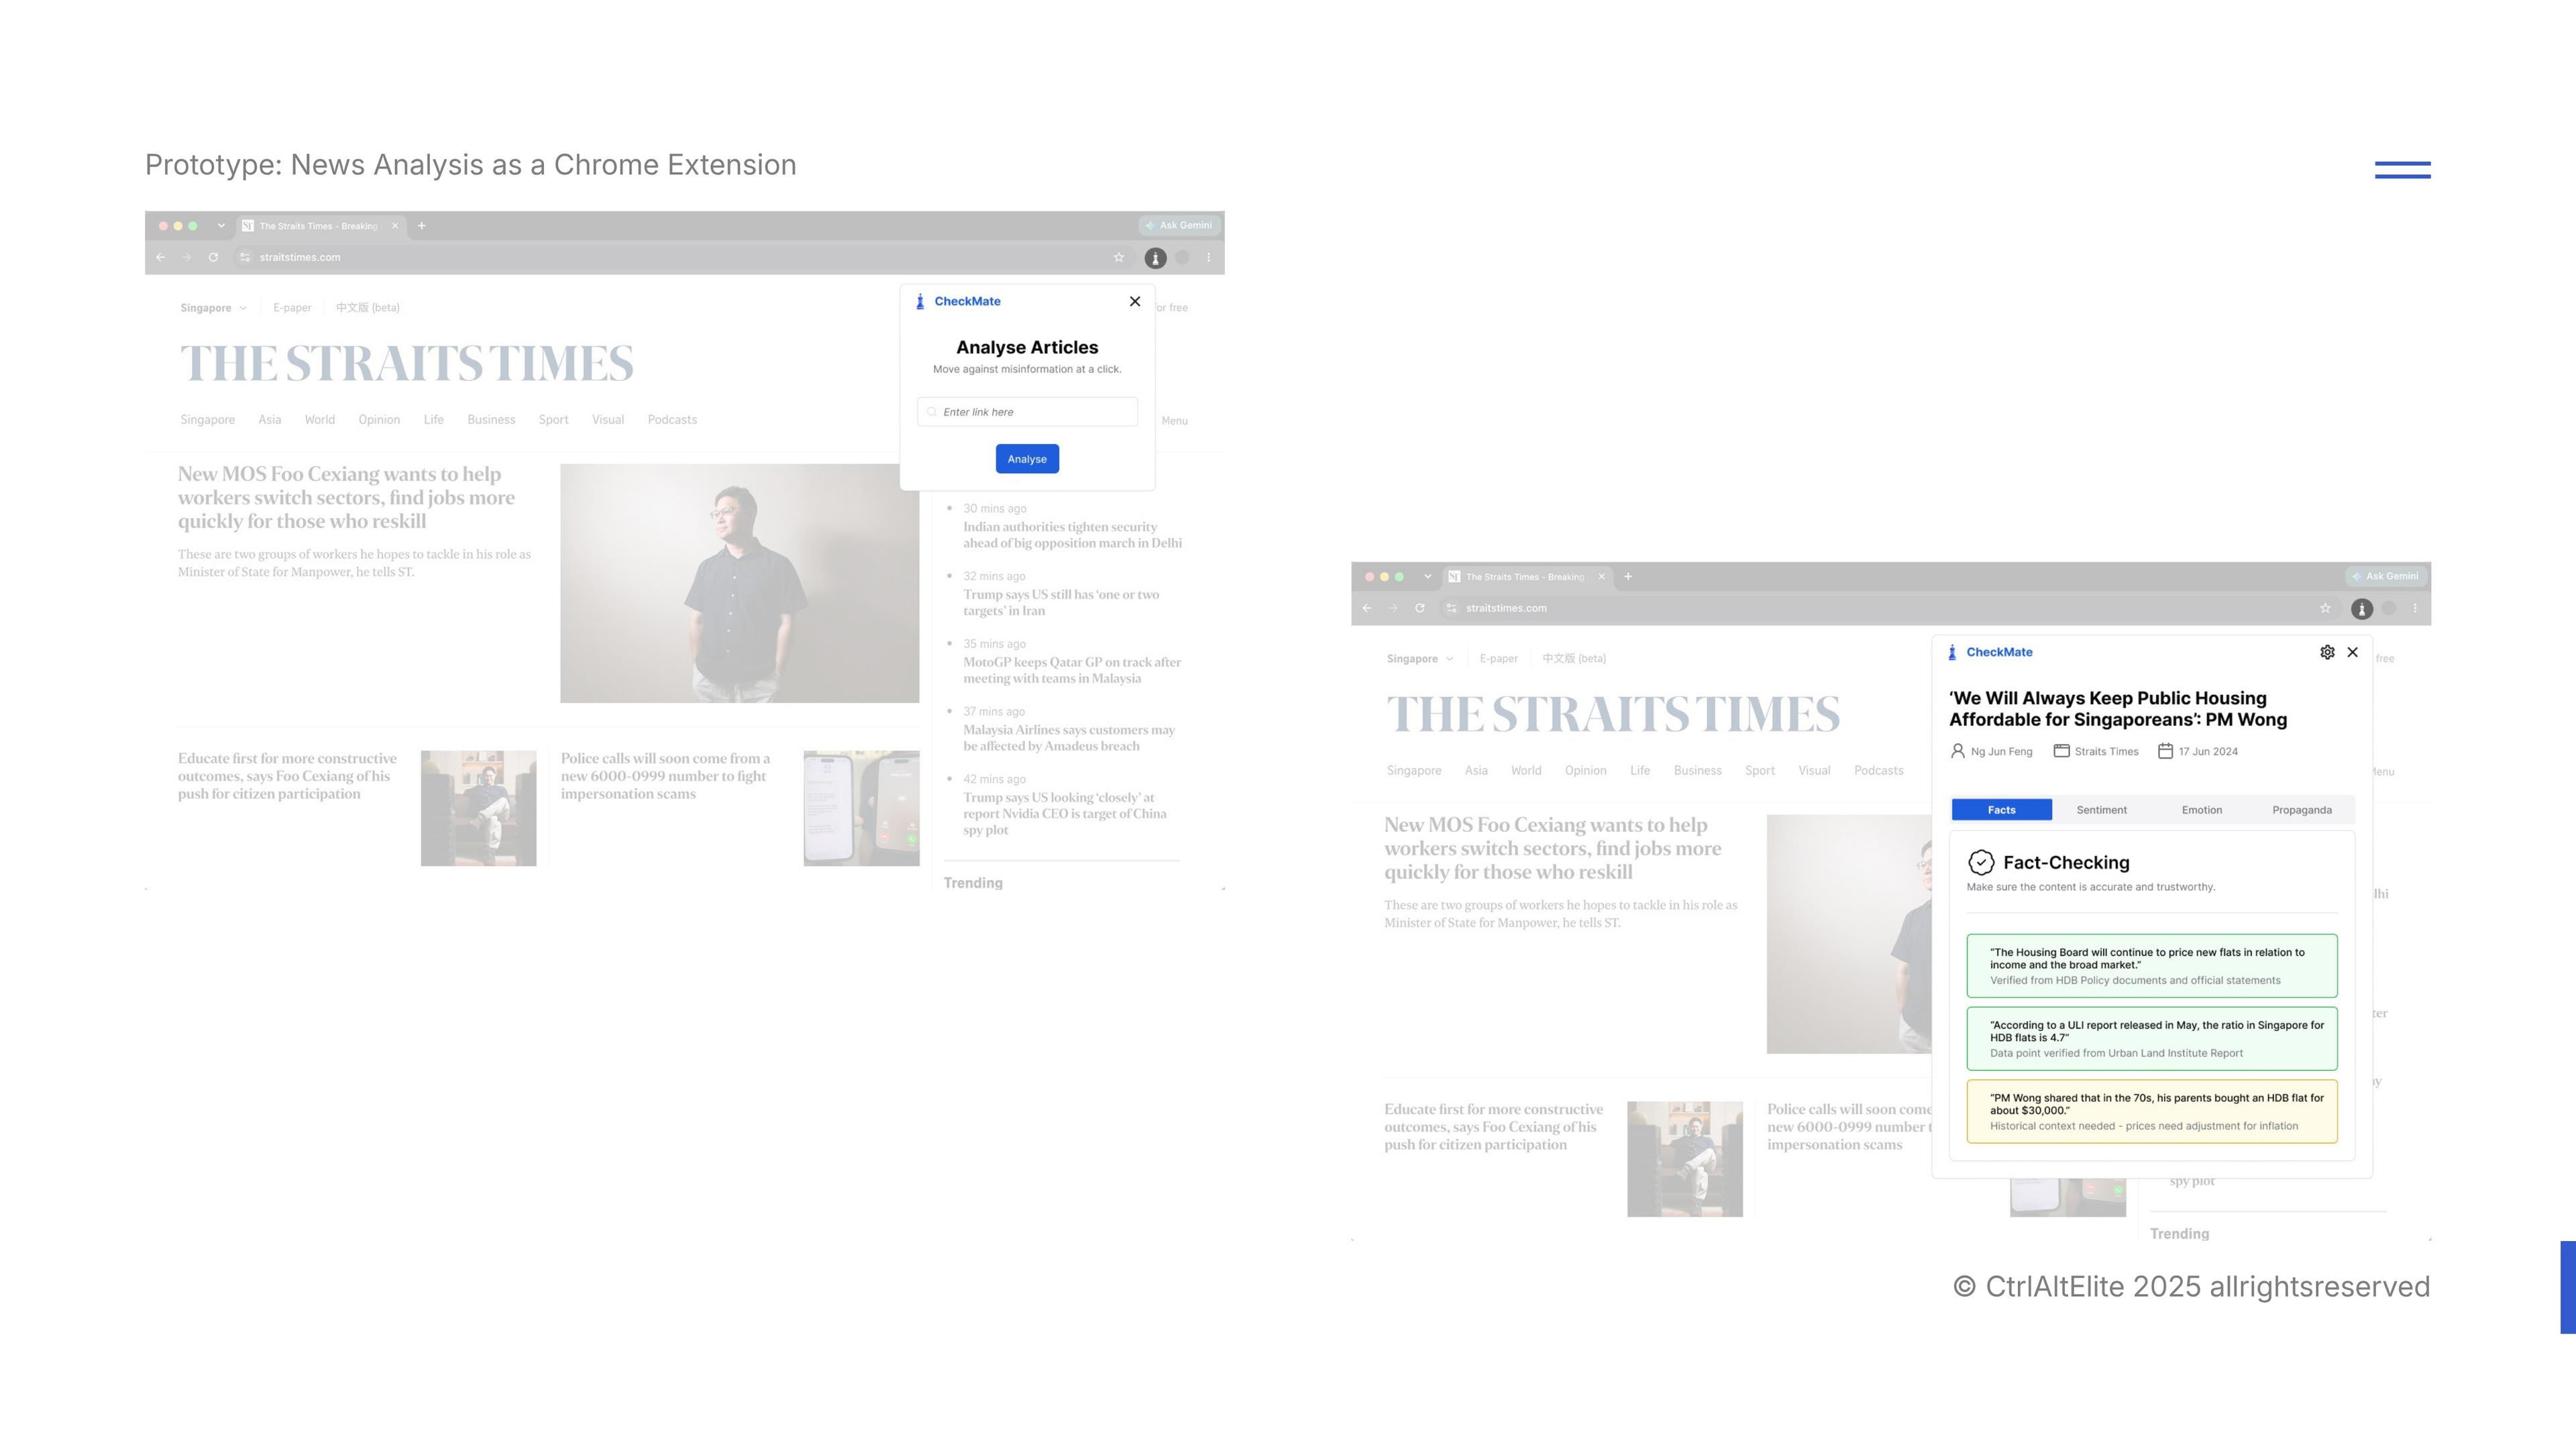
The Chrome extension and Telegram bot gave readers ways to submit an article within their existing browsing and messaging habits. The website provided space for the detailed analysis.
The bot returned a summary with a link to the full analysis. That made access to the link a critical part of the journey, particularly when a response became long.
Information hierarchy
Give each analysis room to be read
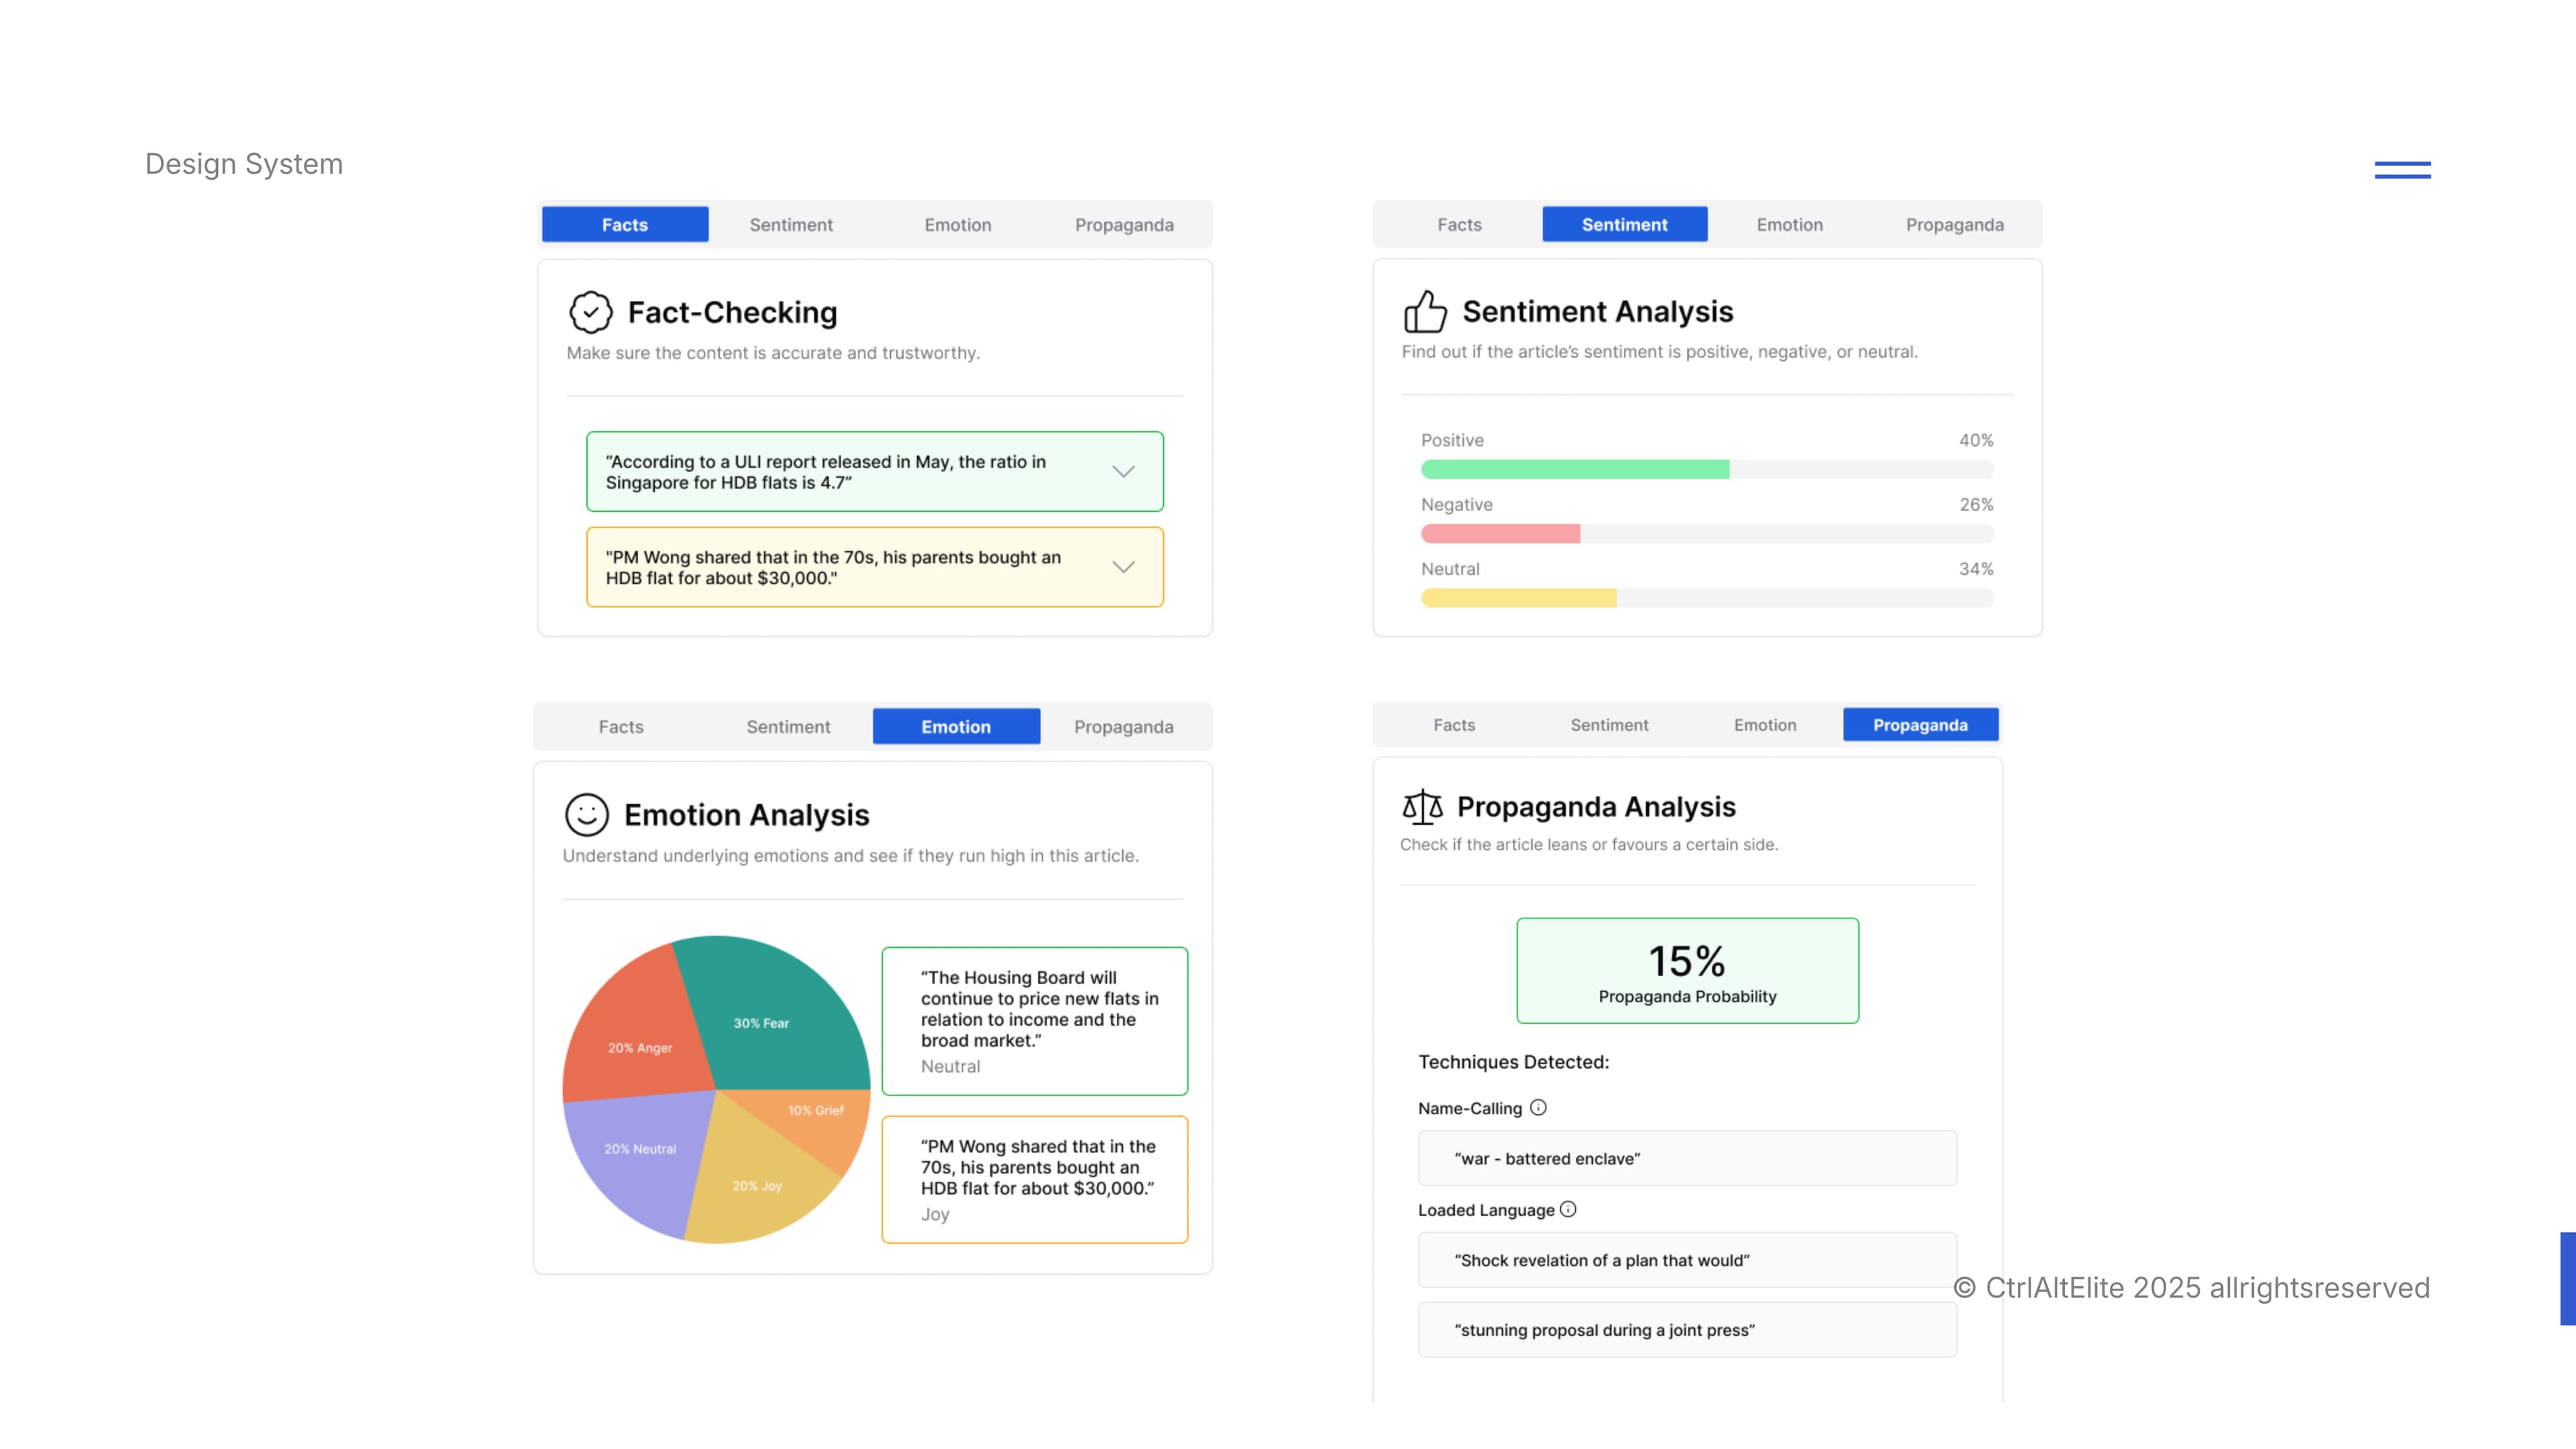
The output covered four categories: fact-checking, emotion, sentiment and propaganda techniques. I organised them into selectable tabs so readers could focus on one category at a time.
The trade-off was that comparing categories required switching views. Prototype testing therefore needed to examine how people found a result and moved between tabs.
Design system
Carry the hierarchy into the interface
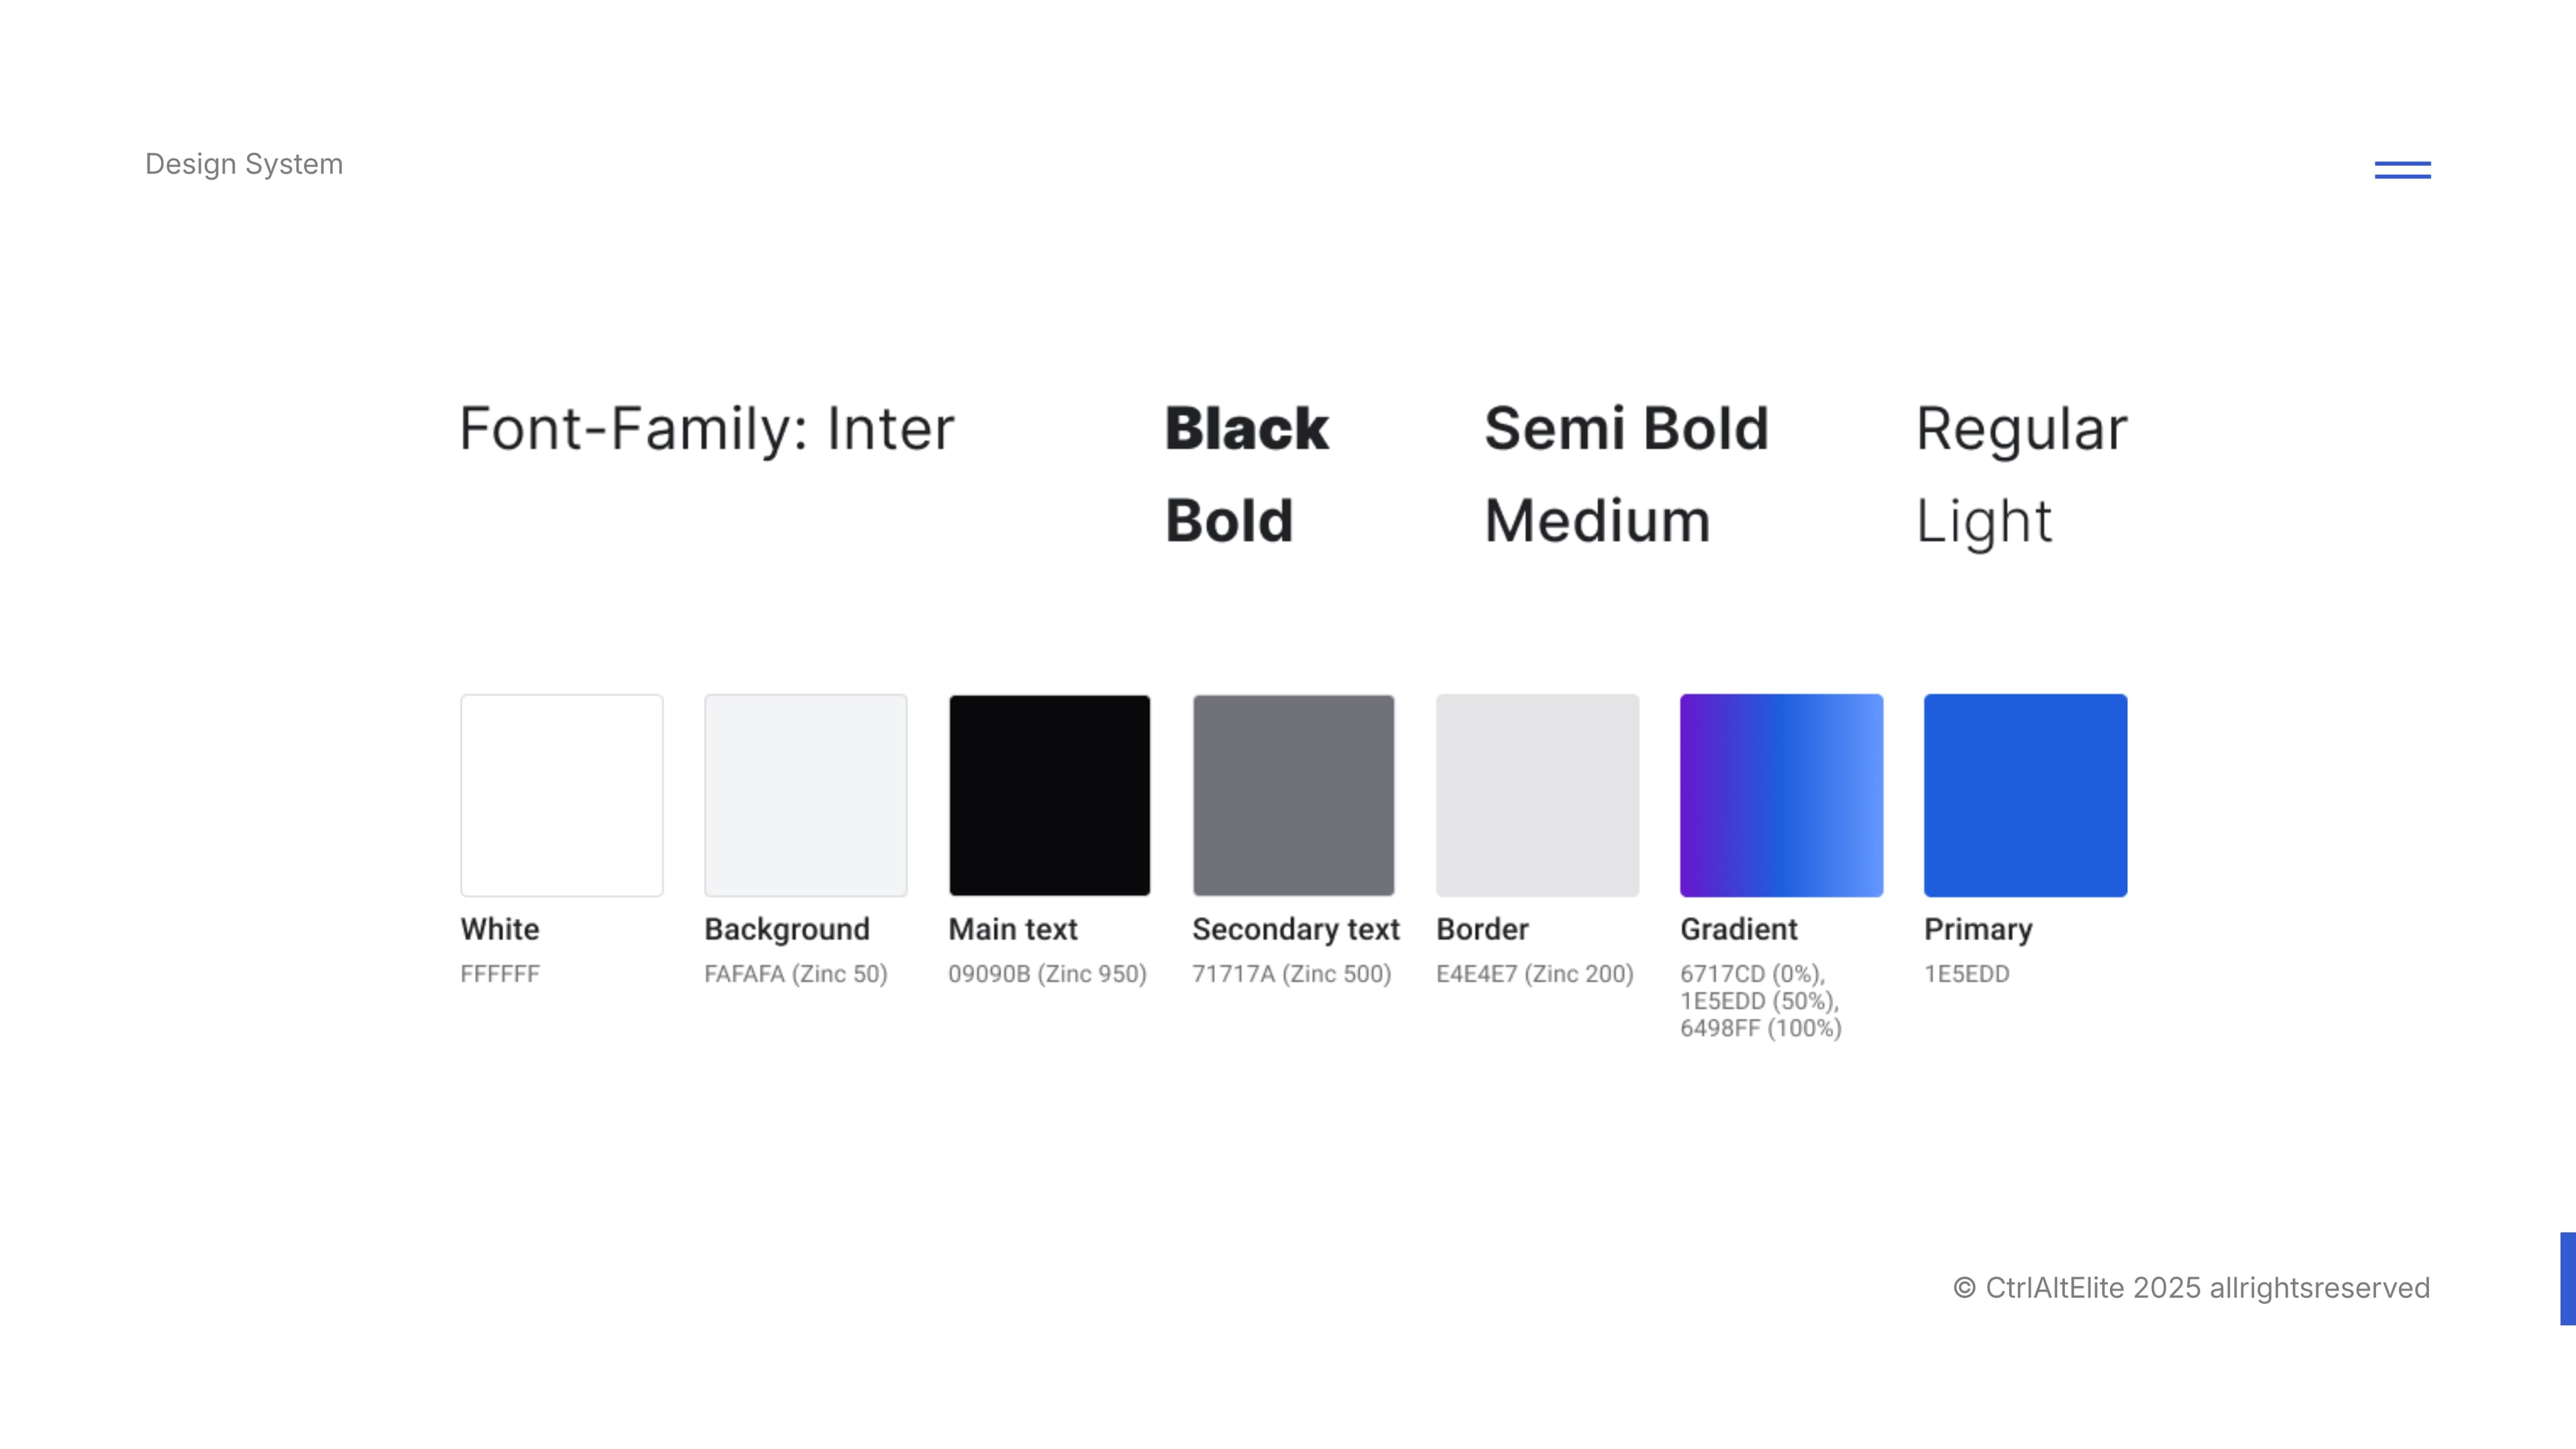
I defined reusable typography, colour and component treatments to keep the analysis views consistent. Inter separated headings, labels and body copy through weight; primary blue identified actions and selected states.
Building the React interface alongside the Figma reference let me carry that hierarchy into component states and navigation behaviour.
04. Prototype findings and iteration
Finding friction between the screens
We set up assigned taks on Maze to participants to examine navigation within the analysis and the handoff between Telegram and web platform.
a | Reaching the sentiment results
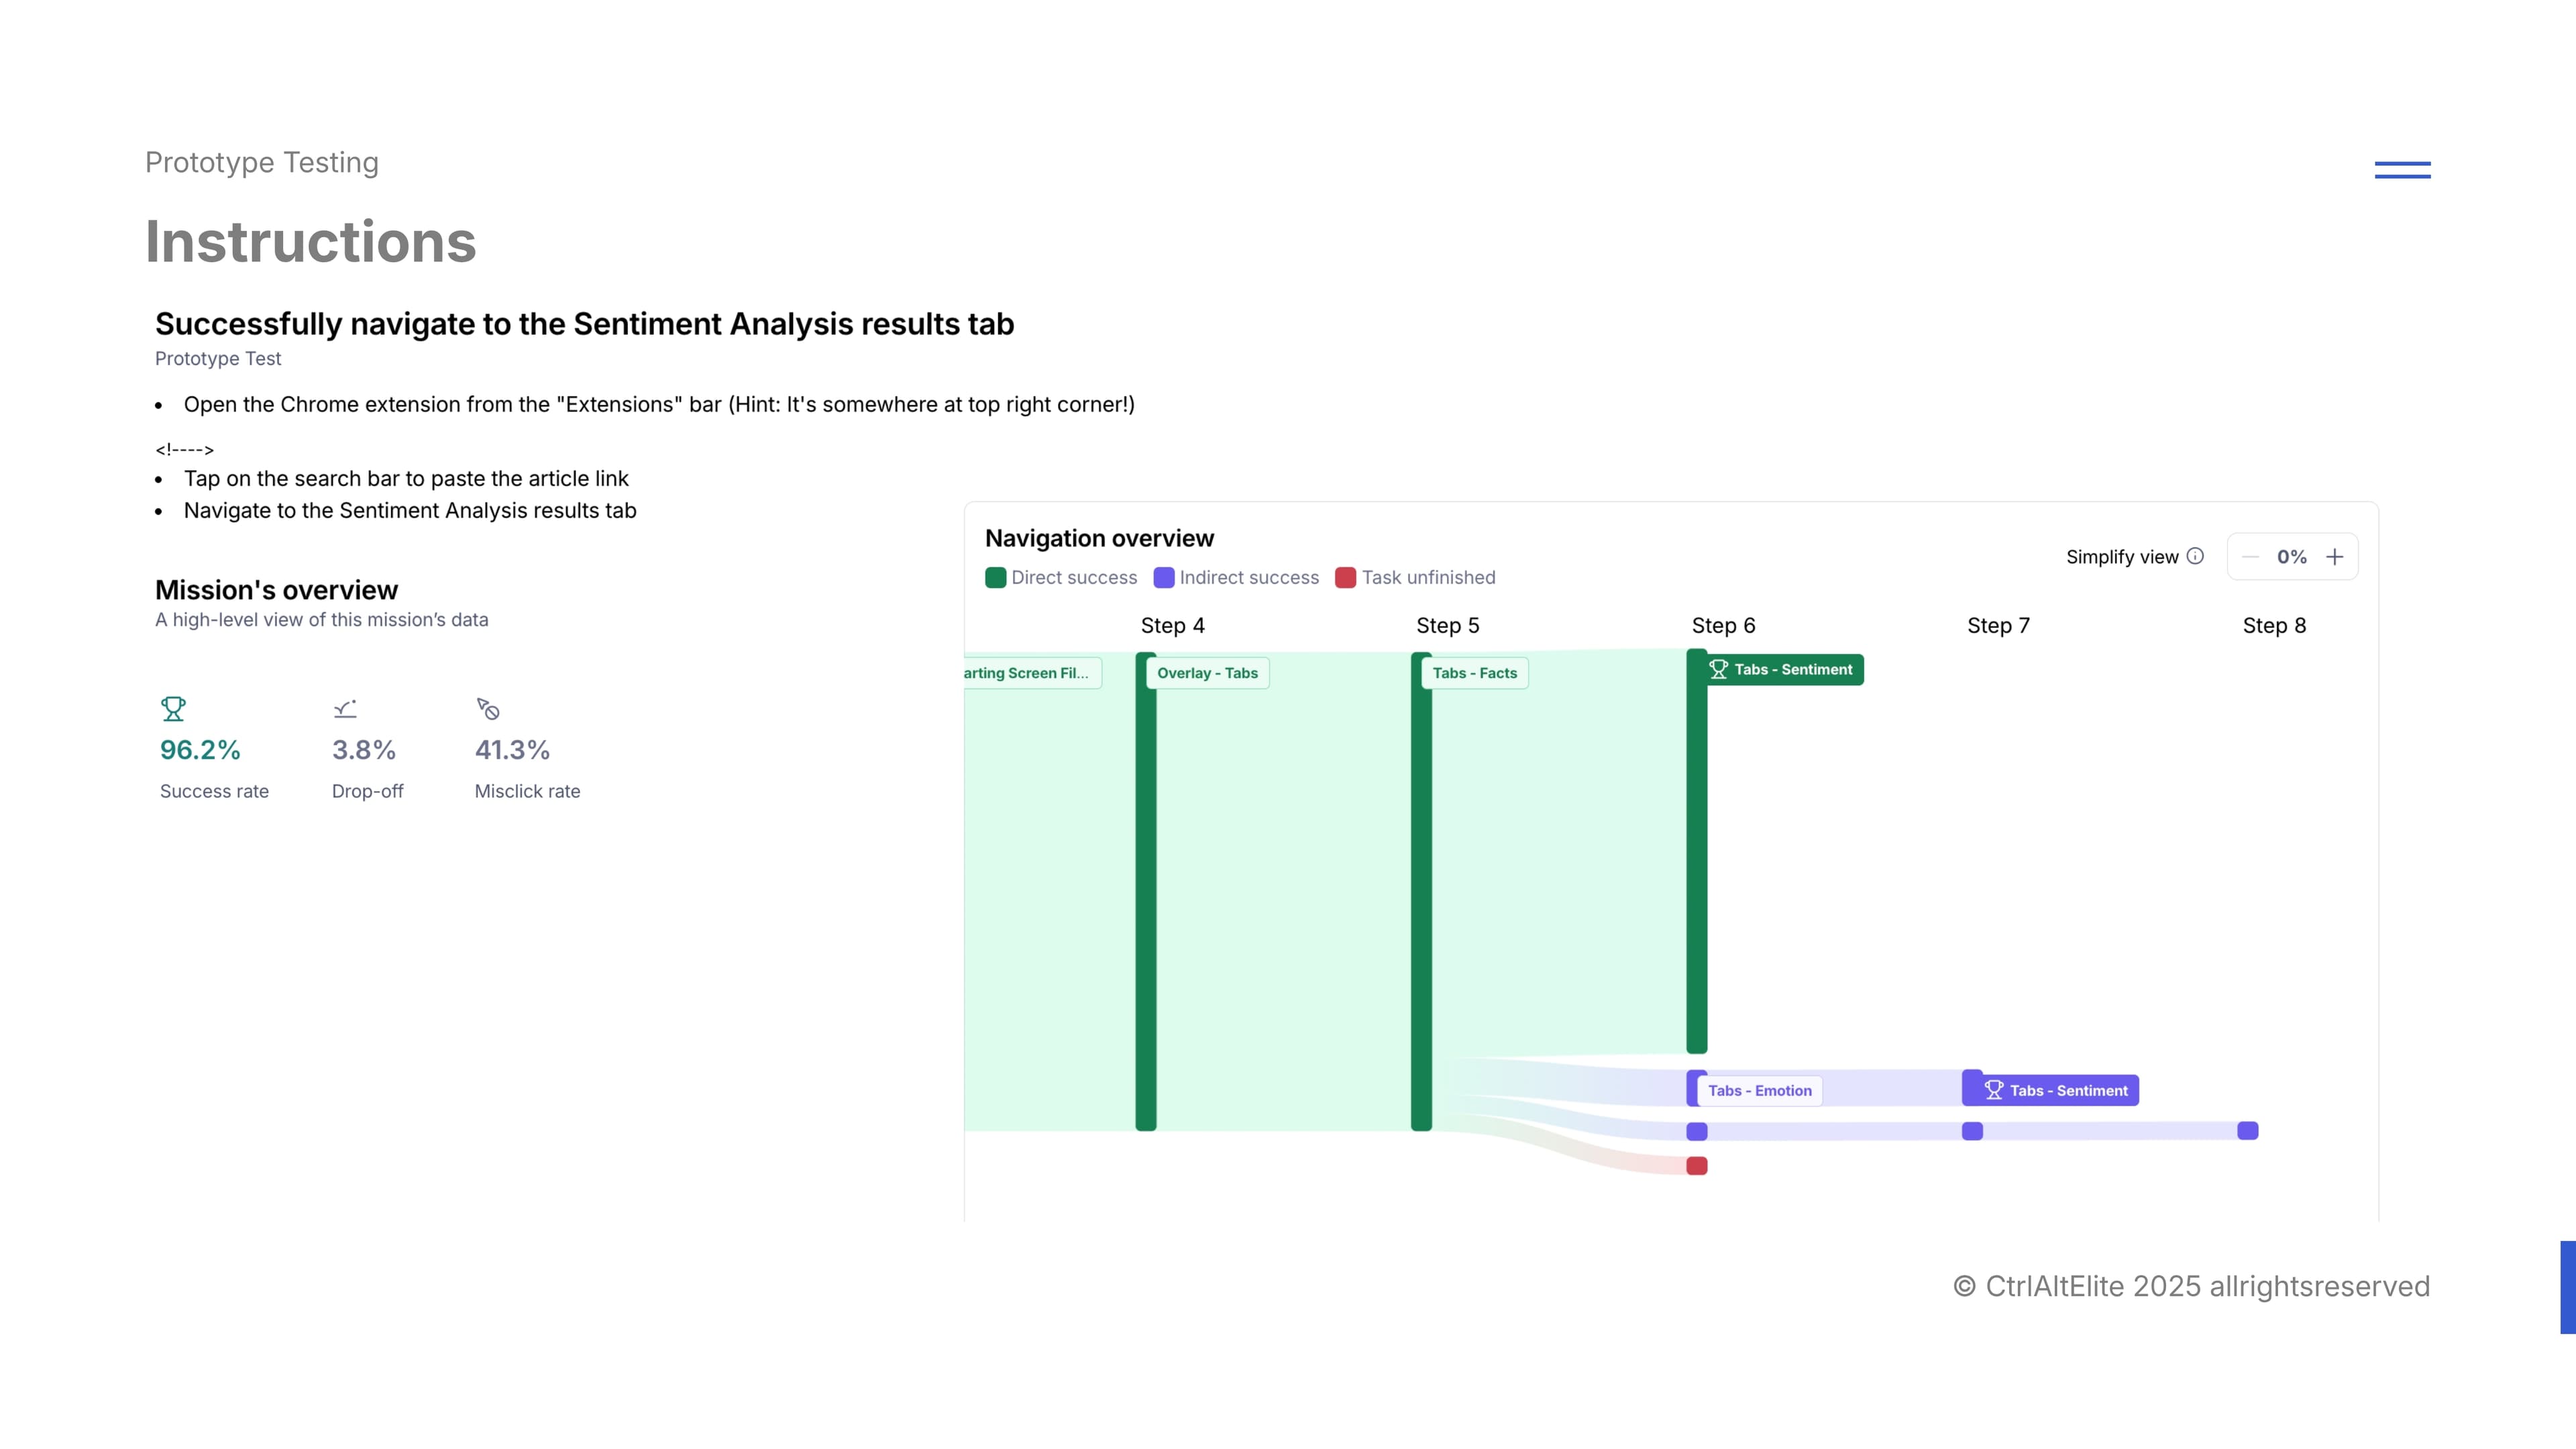
One task asked participants to open the Chrome extension, submit an article link and navigate to the Sentiment Analysis results tab.
Maze reported 96.2% success but a 41.3% misclick rate for this task. The path report had included routes taken by the user through other analysis tabs before reaching the destination. As it did not take the 'usual' path that other users took to get to the sentiment tab directly, Maze reported it as a 'misclick'
However, I decided that the paths alone could not establish whether the detours reflected exploration or confusion, so the success figure needed to be read alongside the navigation behaviour. Given the high success rate, we thus retained the tabs to allow movement between categories.
b | A long response blocked the handoff
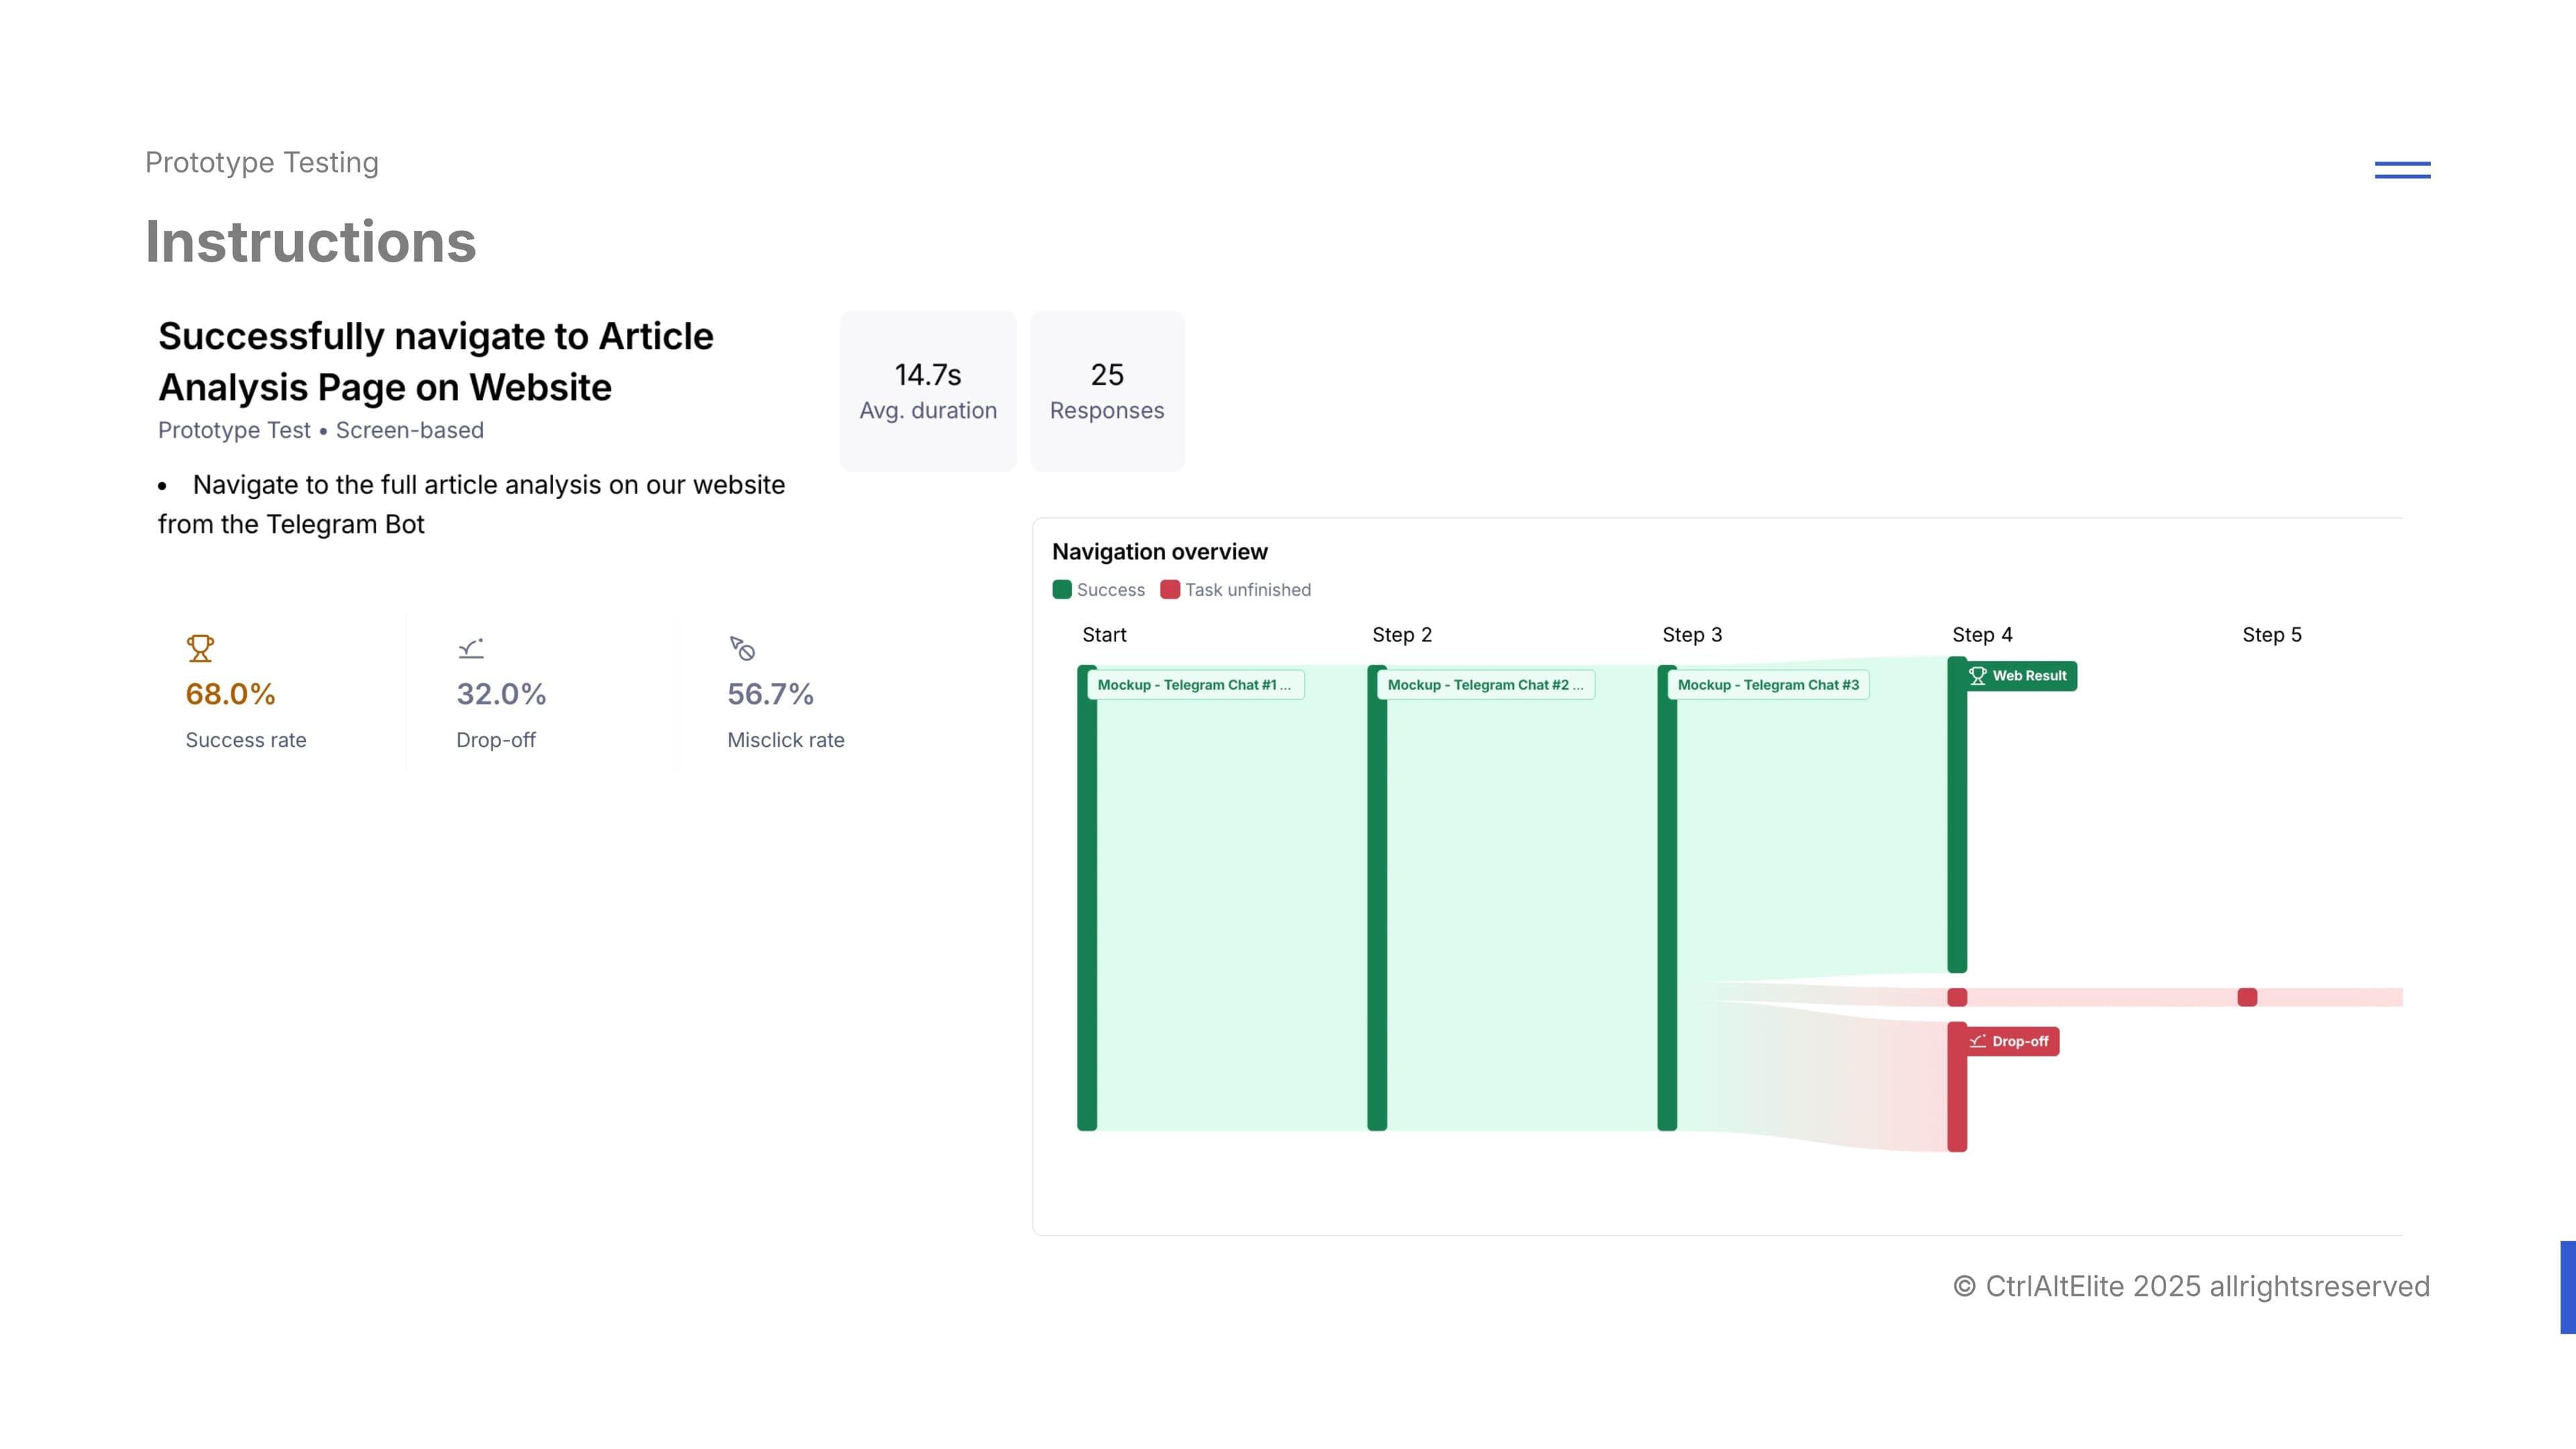
Another issue faced during prototype testing was that in our initial figma interface, long messages overflowed the chat area. Participants could not reach the article link at the bottom to open the website's detailed analysis.
This resulted in a 68.0% success rate and a 32.0% drop-off, indicating an overlook of swiping motions and mobile UI on our part
Making the correction visible
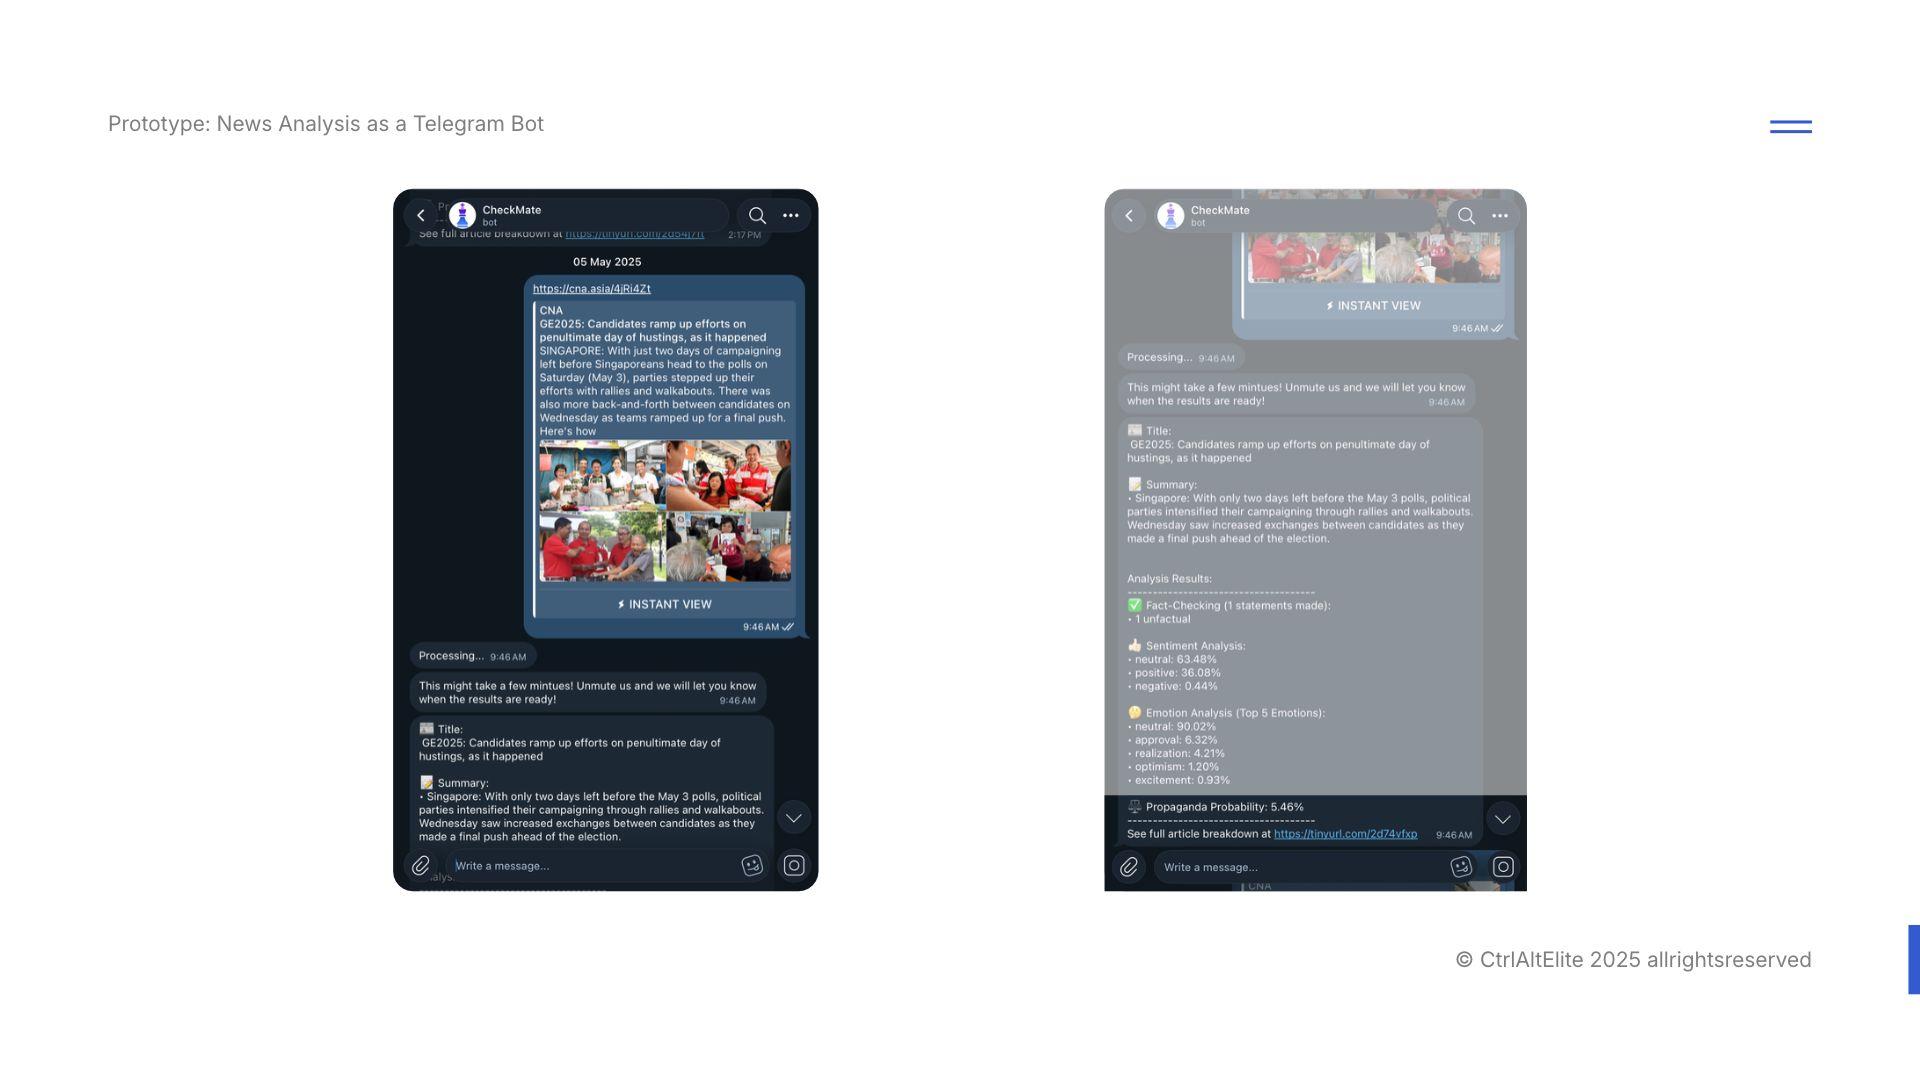
Before the final high-fidelity prototype evaluation, we corrected the mockup’s overflow. While Telegram’s in-app design would have accommodated this in production, the issue reinforced the importance of making the full response accessible, not just visually well-structured.
05. Final prototype evaluation
Evaluating the revised experience
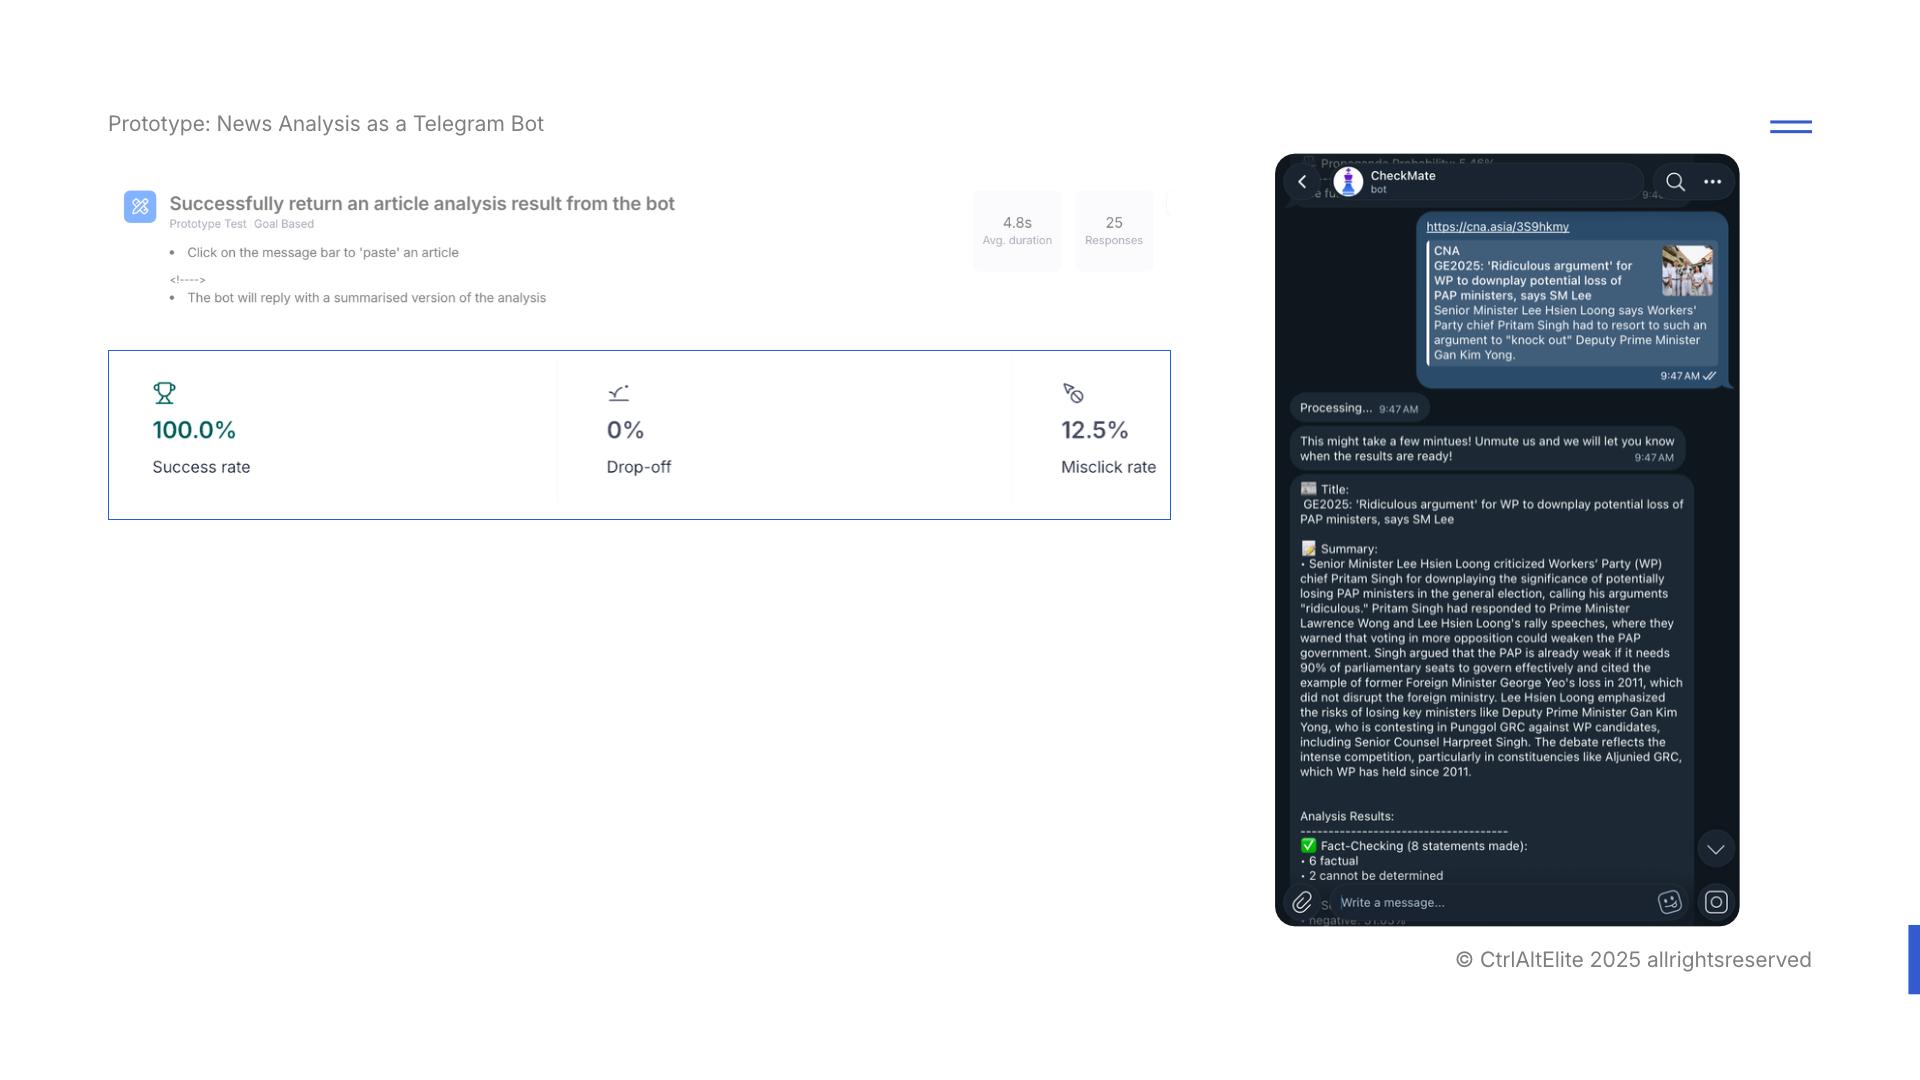
After the overflow correction, we evaluated the revised high-fidelity prototype in Maze. This stage focused on participants' overall perception of the UI, and their ease in navigation across all 3 platforms.
One of the goal-based tasks assigned was a repeat of the previous blocker during intial prototype testing: we asked participants to paste an article link into the Telegram message bar and receive a summarised analysis from the bot again. This time, Maze recorded 0% drop-off.
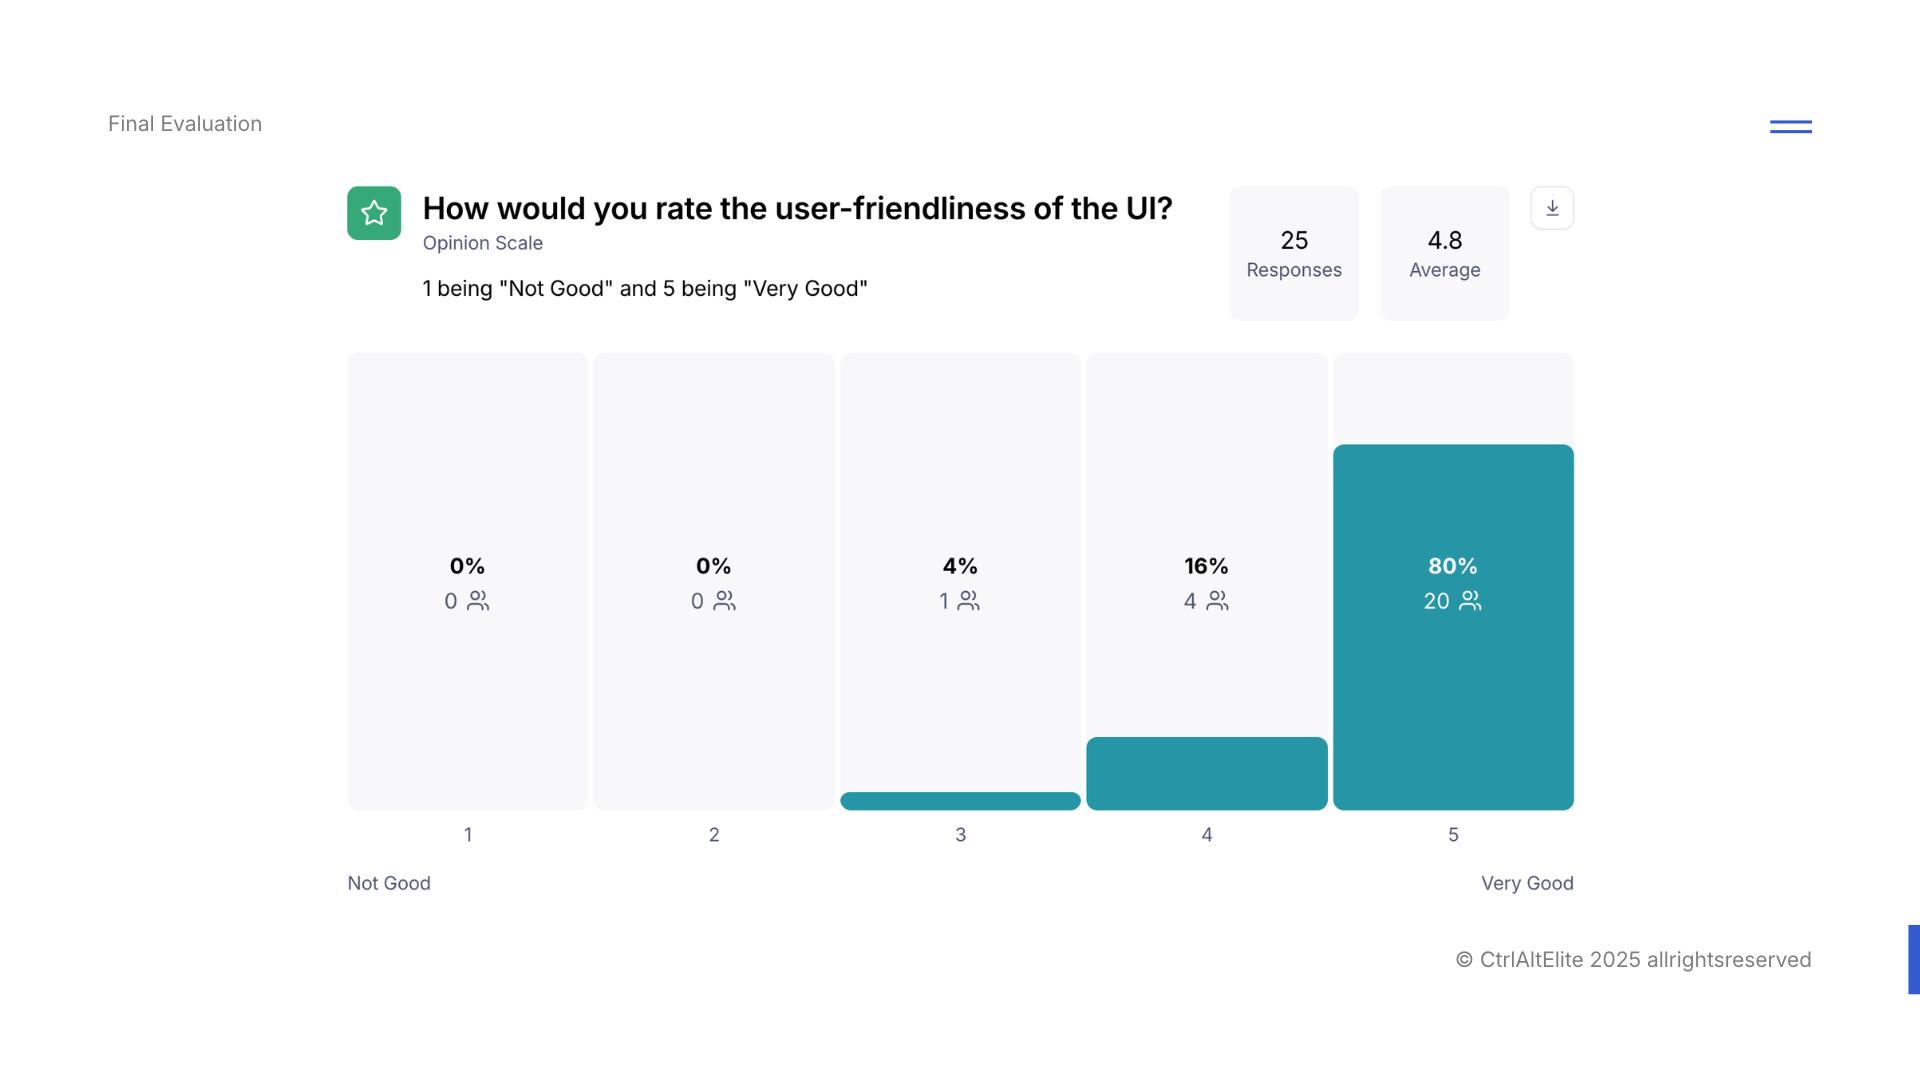
4.8/5
Average UI user-friendliness rating, as displayed by Maze, from 25 responses.
80%
20 of 25 respondents selected 5/5, the highest user-friendliness rating.
0%
Drop-off on the final bot analysis task, which asked participants to submit an article and receive its summary.
How participants rated the interface
The question asked: “How would you rate the user-friendliness of the UI?” The scale ran from 1 (“Not Good”) to 5 (“Very Good”).
Of the 25 responses, 20 selected 5, four selected 4 and one selected 3. Maze displayed an average of 4.8/5. The 80% figure represents those who selected the highest rating.
06. Implementing the experience
Designing for the time between actions
Moving into implementation, we had to additionally factor that machine-learning analysis takes time, especially for longer articles.
Together with the backend engineers, we worked on route-based lazy loading and client-side API response caching. These choices addressed page loading and revisiting results, ensuring that model inference time remained a separate constraint to be handled on its own.
We did not measure the performance time before implementation, hence a metric comparison was not written for this segment.
| design lesson
Loading behaviour and repeated waits are part of the reading experience too.
Load what the route needs
Route-based lazy loading deferred page code until it was needed, reducing the amount loaded upfront.
Reuse available responses
Client-side API caching reused available responses, reducing repeated requests as readers returned to analysed content.
07. Product delivery
Testing the implemented flow with the client
Following prototype evaluation, the team implemented the experience and successfully tested the end-to-end flow with the client. This provided functional confirmation of the implemented journey and is presented here as a qualitative delivery outcome.
As part of our final-year roadshow evaluation, I started our team's presentation of CheckMate to the judging panels, connecting the product's purpose with a demonstration of the experience.
We then moved on to the final closed door evaluation where we eventually clinched 1st Place in the Dell Cloud Native Experience Award. Read the project recap on LinkedIn.

08. Takeaways
The design system continues in the code
Owning both the design reference and the React interface made consistency tangible. Component states, navigation, responsive layouts and loading behaviour all affected how the intended experience survived implementation.
The Telegram issue reinforced the need to follow a journey beyond an individual screen: a readable summary still depended on an accessible link to the next step. Evaluating the revised mockup and then testing the implemented flow with the client addressed different stages of that journey.
What I would validate next
I would test whether readers correctly understand uncertain model outputs, distinguish sentiment from factual accuracy and explain why a claim was flagged. That would connect the goal of approachable analysis with evidence of comprehension and better-informed judgement.
I would also evaluate the waiting experience on slower connections and measure initial-load and repeat-visit performance to establish the user benefit of the implementation choices.
A consistent interface starts in Figma, but its behaviour is decided just as much in the browser.